Author Affiliations
Key Laboratory of Western China's Environmental Systems (Ministry of Education)/College of Earth and Environmental Sciences, Lanzhou University, Lanzhou 730000, Chinashow less
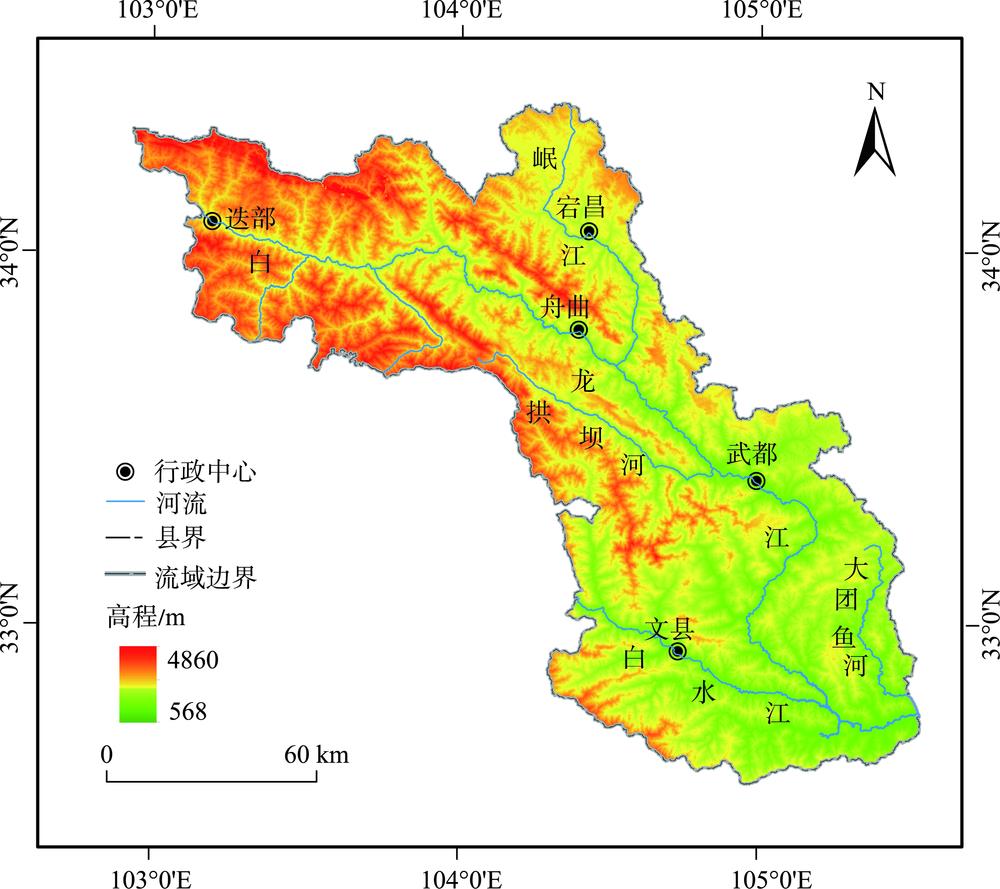
Fig. 1. Location of the study area
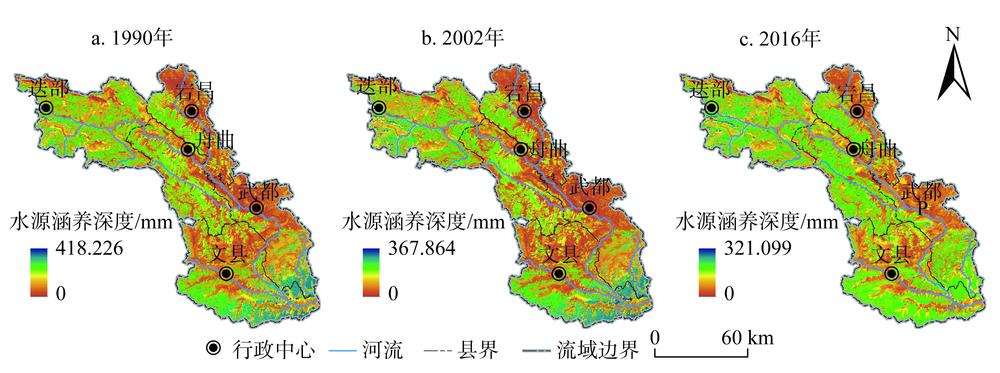
Fig. 2. The spatiotemporal distribution of WC in BLJW in 1990, 2002, 2016
Fig. 3. The distribution of WC in different counties and its influencing factors at BLJW
Fig. 4. The distribution of WC at different elevations and its influencing factors at BLJW
Fig. 5. The distribution of WC in different slopes and its influencing factors at BLJW
Fig. 6. The distribution of WC in different aspects and its influencing factors at BLJW
Fig. 7. The distribution of WC in different land use types and its influencing factors at BLJW
Fig. 8. The spatiotemporal variation of hotspots and coldspots of WC at BLJW
Fig. 9. The annual precipitation and average annual temperature change at BLJW
Fig. 10. The effects of meteorological factors and land use on WC at BLJW
Fig. 11. The contribution rate of each factor in the watershed and inner zones at BLJW
Fig. 12. The contribution rate of two-factor interactive in the watershed and inner zones at BLJW
所需数据 | 本地化处理 |
---|
土地利用 | 下载自美国地质调查局的30 m空间分辨率的Landsat TM/ETM+遥感影像;参考《土地利用现状分类标准》(GB/T 21010-2007)并结合研究区实际情况,对1990—2016年三期影像进行目视解译获得 | 降水 | 根据中国气象科学数据共享服务网(http://data.cma.cn)、流域及流域周边各县区气象局18个站点的1990—2016年月降水量进行空间插值获得 | 潜在蒸散 | 基于采用Modified-Hargreaves公式计算,其中所需数据包括1990—2016年各气象站点的日最高气温、日最低气温和太阳顶层辐射等 | (子)流域 | 基于DEM数据在ArcSWAT平台上提取 | 土壤深度 | 基于甘肃第二次土壤普查数据,并结合野外土壤样点剖面数据得到 | 根系深度 | 参考相关研究成果[16],以土地利用/覆被类型为单元构建根系深度CSV表格 | 植物可利用水 | 基于甘肃省土壤普查数据,PAWC为田间持水量和永久萎蔫系数的差值,两者分别由经验公式计算[25] | 径流系数 | 参考模型参数表数据 | 地形指数 | 根据土壤深度、百分坡度和汇水面积计算获得 | 土壤饱和导水率 | 采用流域实测的土壤粘粒、粉粒和粗砂百分比含量在Wosten模型中计算获得 | DEM | 从USGS官网(https://www.usgs.gov)上获取,空间分辨率为30 m | NDVI | MOD13Q1卫星数据,空间分辨率为250 m | 人口密度、粮食单产量单位面积载畜量 | 根据甘肃省基础地理信息中心提供的乡镇边界对各县区统计年鉴中的人口、农牧业信息进行空间可视化 | 综合景观破碎度 | 以边缘密度ED、蔓延多样性SHDI和蔓延度指数CONTAD的综合指标插值获得[26] | 土地利用强度 | 在乡镇单元上根据土地利用强度指数计算获得[27] |
|
Table 1. Data sources and localization processing
社会生态指标 | 流域 | 高值区 | | 低值区 |
---|
流域东南部 | 迭部东南部 | 武都中北部 | 宕昌北部 |
---|
水源涵养量/mm | 48.80 | 59.44 | 55.65 | | 29.10 | 22.02 | 气候 | 降水/mm | 549.45 | 583.26 | 575.65 | 523.41 | 514.29 | 温度/C° | 12.16 | 15.54 | 9.21 | 14.61 | | 9.50 | 地形 | 高程/m | 2323.21 | 1606.71 | 2934.34 | 1987.47 | 2554.57 | 坡度/(°) | 26.28 | 29.30 | 29.70 | 25.64 | | 18.24 | 土壤类型(比例/%) | 棕壤(29.96) 暗棕壤(17.78) | 棕壤(47.85) 黄棕壤(25.56) | 棕壤(37.38) 暗棕壤(31.95) | 淋溶褐土(25.11) 石灰性褐土(22.91) | 黑土(59.08) 淡黑钙土(22.77) | 自然 景观 | 主要地类 (比例/%) | 林地(53.12) 草地(29.81) | 林地(76.22) 草地(12.48) | 林地(56.20) 草地(35.34) | 草地(47.33) 耕地(27.06) | 耕地(52.27) 草地(33.18) | 植被覆盖度 | 0.54 | 0.67 | 0.56 | 0.48 | | 0.43 | ED | 23.41 | 21.40 | 21.52 | 21.12 | | 30.20 | SHDI | 0.88 | 0.68 | 0.91 | 0.97 | | 0.96 | CONTAD | 66.89 | 74.00 | 65.92 | 64.98 | | 63.21 | 农牧业发展 | 人口密度/(人/km2) | 88.74 | 42.73 | 11.25 | 178.64 | 167.93 | 各乡镇农作物单产(t/km2) | 34.00 | 15.06 | 3.94 | 70.36 | | 65.16 | 各乡镇载畜量 (头/km2) | 66.64 | 41.44 | 63.73 | 109.57 | | 51.75 |
|
Table 2. The regional differences of socio-ecological elements at BLJW
年份 | 降水 | 潜在蒸散 | 用地强度 | NDVI | 景观破碎度 | 人口密度 |
---|
1990 | 0.575** | -0.196 | -0.839** | 0.571** | -0.313** | -0.609** | 2002 | 0.699** | -0.250* | -0.842** | 0.859** | -0.305** | -0.485** | 2016 | 0.189 | -0.144 | -0.938** | 0.909** | -0.411** | -0.591** |
|
Table 3. The static influencing factors of WC at BLJW
时段/年 | 降水变化 | 潜在蒸散变化 | 用地强度变化 | NDVI变化 | 景观破碎度变化 | 人口密度变化 |
---|
1990—2002 | 0.215* | -0.214* | -0.538** | -0.185 | 0.03 | 0.182 | 2002—2016 | 0.595** | 0.042 | -0.315** | 0.163 | -0.377** | -0.018 |
|
Table 4. The dynamic influencing factors of WC at BLJW