• Chinese Optics Letters
  • Vol. 15, Issue 7, 070605 (2017)
Yuheng Pan1、2, Junfeng Jiang1、*, Weijia Lu2, Huijia Yang1, Kun Liu1, Shuang Wang1, Hui Wang1, and Tiegen Liu1
Author Affiliations
  • 1Key Laboratory of Optoelectronics Information Technology, Institute of Optical Fiber Sensing of Tianjin University, MEC, Tianjin 300072, China
  • 2School of Computer and Information Engineering, Tianjin Chengjian University, Tianjin 300384, China
  • show less
    DOI: 10.3788/COL201715.070605 Cite this Article Set citation alerts
    Yuheng Pan, Junfeng Jiang, Weijia Lu, Huijia Yang, Kun Liu, Shuang Wang, Hui Wang, Tiegen Liu. Spectrum-profile-identification-based wavelength division multiplexing method for a fiber Bragg grating sensor[J]. Chinese Optics Letters, 2017, 15(7): 070605 Copy Citation Text show less
    Schematic diagram of the system.
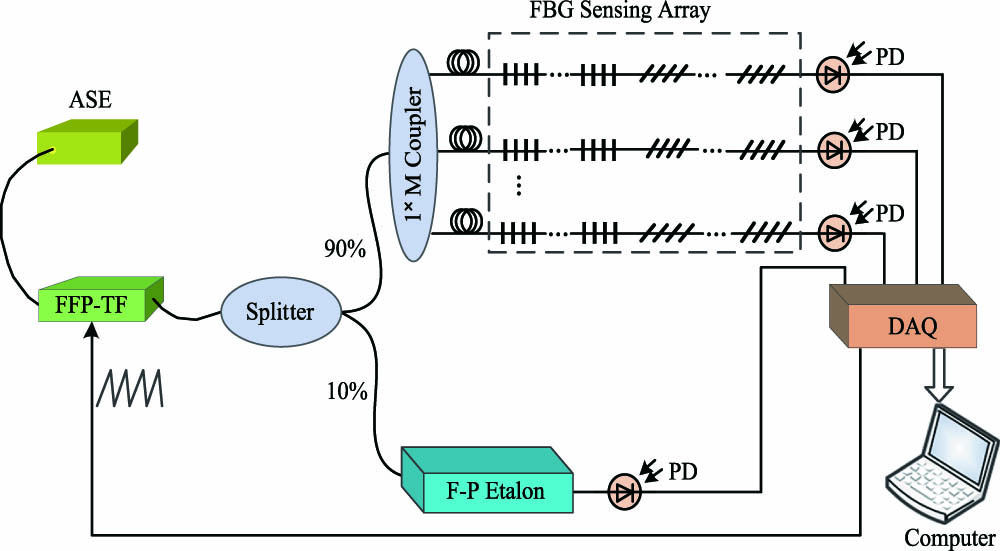
    Fig. 1. Schematic diagram of the system.
    Experimental spectra of the sensors at 20°C: (a) spectrum of the FBG1, (b) spectrum of the FBG2, (c) spectrum of TFBG, and (d) spectrum of cascaded FBGs and TFBG.
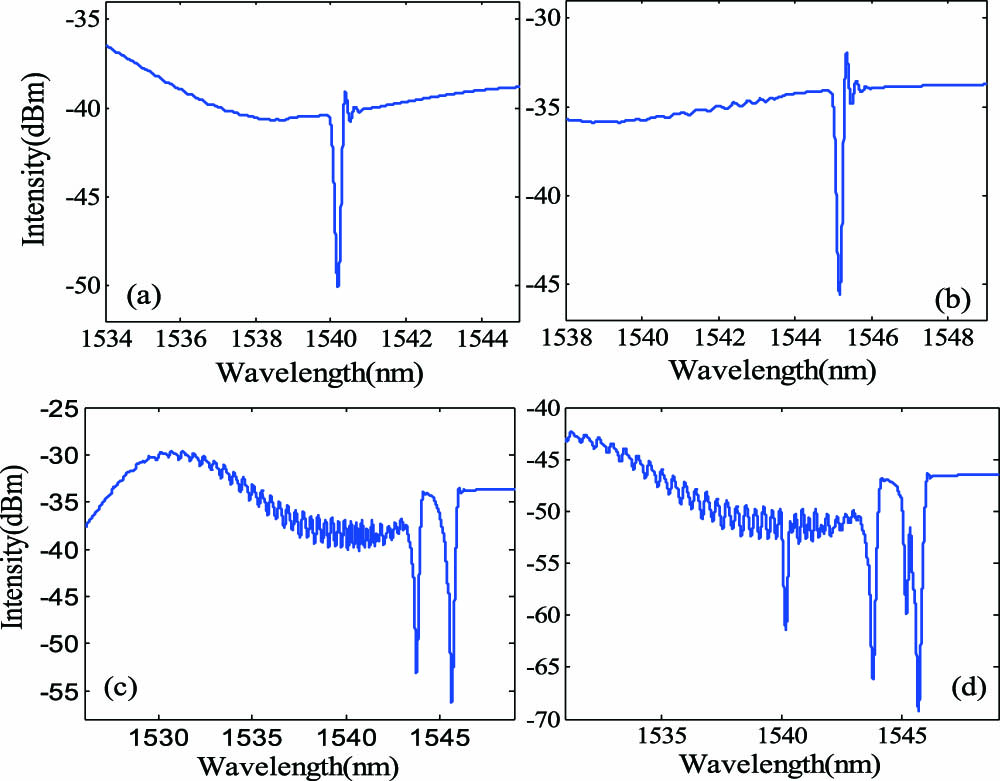
    Fig. 2. Experimental spectra of the sensors at 20°C: (a) spectrum of the FBG1, (b) spectrum of the FBG2, (c) spectrum of TFBG, and (d) spectrum of cascaded FBGs and TFBG.
    (Color online) Spectra of the cascaded FBG2 and TFBG at different temperatures.
    Fig. 3. (Color online) Spectra of the cascaded FBG2 and TFBG at different temperatures.
    (Color online) Cross-correlation curve of (a) FBG2 and (b) TFBG.
    Fig. 4. (Color online) Cross-correlation curve of (a) FBG2 and (b) TFBG.
    Peak of the cross-correlation curve and temperature relationship of (a) FBG2 and (b) TFBG.
    Fig. 5. Peak of the cross-correlation curve and temperature relationship of (a) FBG2 and (b) TFBG.
    (Color online) Spectra of the cascaded FBGs and TFBG at different temperatures.
    Fig. 6. (Color online) Spectra of the cascaded FBGs and TFBG at different temperatures.
    (Color online) Cross-correlation curve of (a) FBG1 and (b) FBG2.
    Fig. 7. (Color online) Cross-correlation curve of (a) FBG1 and (b) FBG2.
    Peak of the cross-correlation curve and temperature relationship of (a) FBG1 and (b) FBG2.
    Fig. 8. Peak of the cross-correlation curve and temperature relationship of (a) FBG1 and (b) FBG2.
     Maximum error (°C) 
     PlusMinusVariance
    FBG11.051.300.72
    FBG22.703.232.95
    TFBG1.081.460.89
    Table 1. Measured Errors of this Method
    Yuheng Pan, Junfeng Jiang, Weijia Lu, Huijia Yang, Kun Liu, Shuang Wang, Hui Wang, Tiegen Liu. Spectrum-profile-identification-based wavelength division multiplexing method for a fiber Bragg grating sensor[J]. Chinese Optics Letters, 2017, 15(7): 070605
    Download Citation