
Yu Yin, Shi Li, Shunbin Wang, Shijie Jia, Jing Ren, Gerald Farrell, Elfed Lewis, Pengfei Wang. Ultra-high-resolution detection of Pb2+ ions using a black phosphorus functionalized microfiber coil resonator[J]. Photonics Research, 2019, 7(6): 622
- Photonics Research
- Vol. 7, Issue 6, 622 (2019)
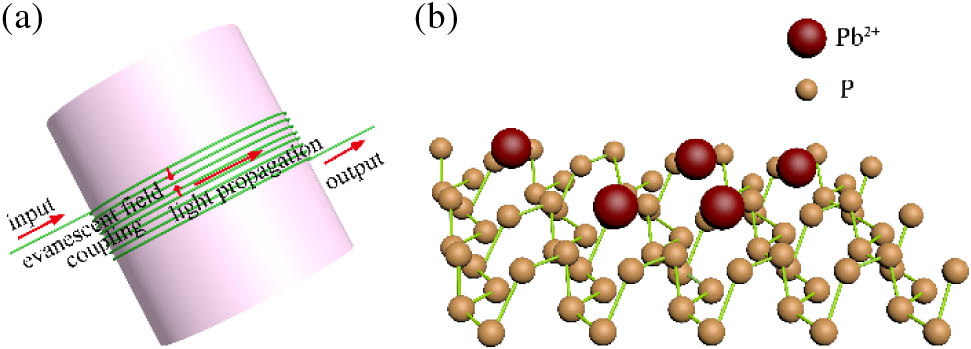
Fig. 1. (a) Schematic diagram of the MCR. (b) Adsorption between BP and Pb 2 +
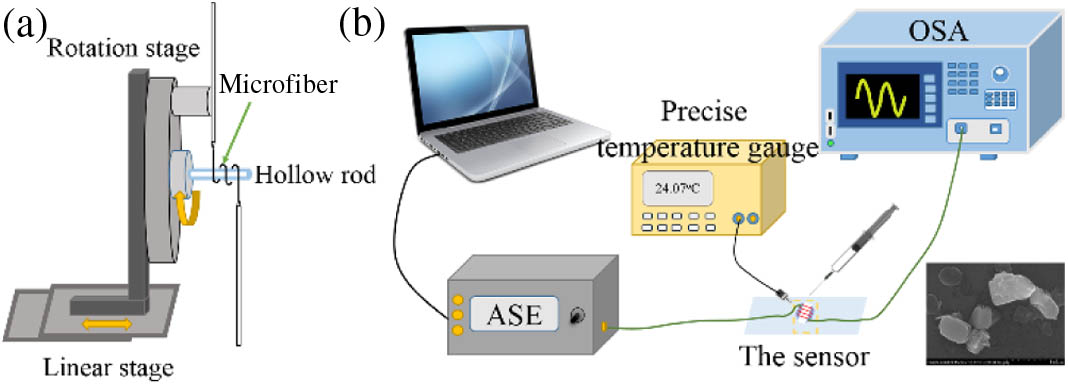
Fig. 2. (a) Schematic diagram of MCR fabrication process. (b) Schematic diagram of BP deposition and the Pb 2 +
Fig. 3. (a) Spectral response of sensor without BP functionalized to varying Pb 2 +
Fig. 4. (a) Transmission spectra in the BP deposition. (b) Response time curve for the deposition of BP on the MCR.
Fig. 5. Spectral evolution before and after several cycles of BP deposition.
Fig. 6. (a) Resonance wavelength change against the number of deposition cycles. (b) Extinction ratio change against the number of deposition cycles.
Fig. 7. (a) Transmission spectra of the BP-MCR sensor with different concentrations of Pb 2 +
Fig. 8. Langmuir mode of the resonance wavelength shift with concentration of Pb 2 +
Fig. 9. Response time curves with the BP-MCR sensor immersed in Pb 2 +
Fig. 10. (a) Transmission spectra of the BP functionalized sensor at different temperatures. (b) Linear fitting of the temperature response of the BP functionalized sensor. The points are experimental data, and the line is the linear fit of experimental data to temperature.
Fig. 11. Resonance wavelength shift of the BP-MCR sensor with different pH values of the solution.
Fig. 12. Resonance wavelength shifts of the BP functionalized sensor for Pb 2 +
|
Table 1. Summary of Different Kinds of Sensors for Pb 2 +

Set citation alerts for the article
Please enter your email address
© Copyright 2018-2021 | Chinese Laser Press. All Rights Reserved 沪ICP备15018463号-20