
Weigang Li, Yang Mei, Xiang Fan, Yuntao Zhao. Railway Track Detection Based on Vehicle Laser Point Cloud[J]. Chinese Journal of Lasers, 2022, 49(4): 0410002
- Chinese Journal of Lasers
- Vol. 49, Issue 4, 0410002 (2022)
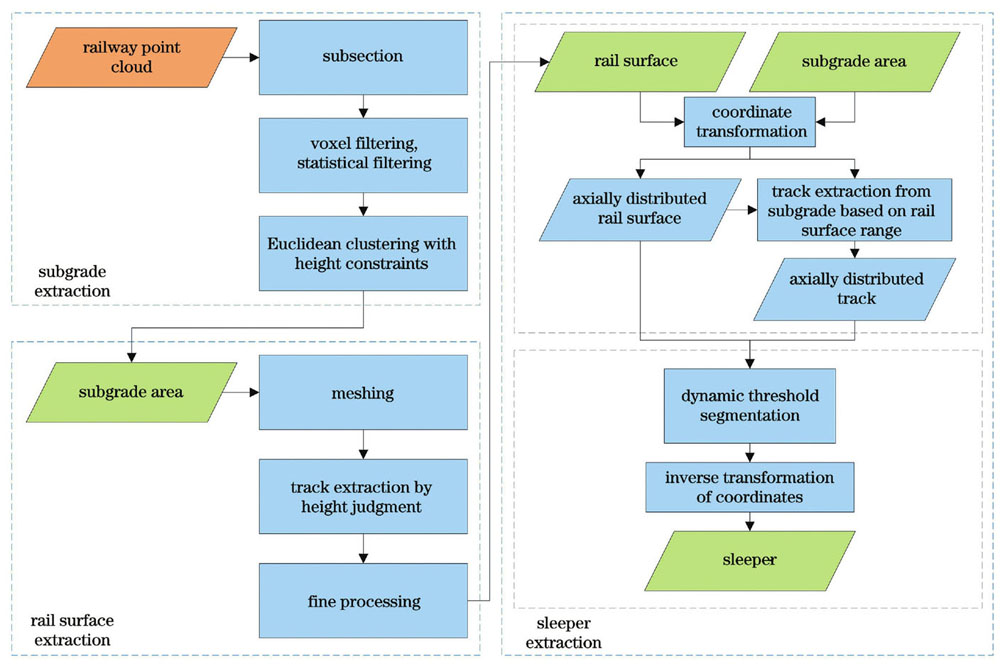
Fig. 1. Flow of track detection algorithm
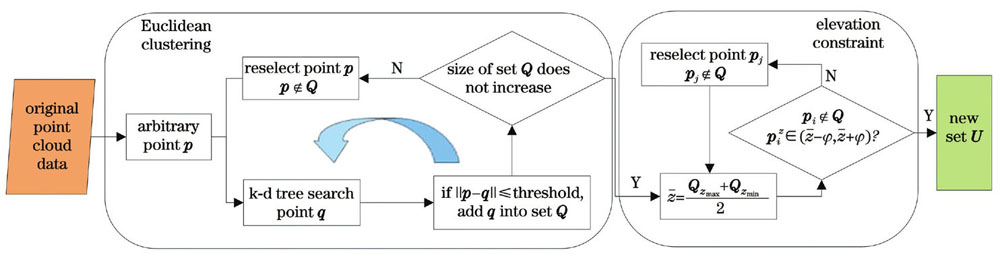
Fig. 2. Flow of Euclidean clustering based on elevation constraints
Fig. 3. Rail track diagram. (a) Track section; (b) rail section
Fig. 4. Sleeper details. (a) Top view of non-bridge area; (b) side view of non-bridge area; (c) top view of bridge area; (d) side view of bridge area
Fig. 5. Extraction effect of subgrade area
Fig. 6. Detection effect of rail surface point cloud under different grid sizes. (a)(f) Grid size is 0.04 m; (b)(g) grid size is 0.06 m; (c)(h) grid size is 0.08 m; (d)(i) grid size is 0.10 m; (e)(j) grid size is 0.12 m
Fig. 7. Effect of sleeper point cloud detection in different areas. (a) Non-bridge area; (b) bridge area
Fig. 8. Point cloud detection effect of rail surface and sleeper in different areas. (a)(d) Effect of rail surface extraction; (b)(e) effect of sleeper extraction; (c)(f) overall effect
| ||||||||||||||||||||||||||||||||||||||||||||||||||||||
Table 1. Accuracy of rail extraction under different grid sizes unit: %
| ||||||||||||||||||||||||||||||||||
Table 2. Comparison of extraction results of rail surface using two methods unit: %
|
Table 3. Accuracy of sleeper extraction in different basic thresholds dth of non-bridge area unit: %
|
Table 4. Accuracy of sleeper extraction in different basic thresholds dth of bridge area unit: %

Set citation alerts for the article
Please enter your email address
© Copyright 2018-2021 | Chinese Laser Press. All Rights Reserved 沪ICP备15018463号-20