• Chinese Optics Letters
  • Vol. 15, Issue 8, 081601 (2017)
Yushuang Qi1, Lei Zhao2, Wenjuan Bian1, Xue Yu1、3、*, Xuhui Xu1、3, and Jianbei Qiu1、3
Author Affiliations
  • 1College of Materials Science and Engineering, Kunming University of Science and Technology, Kunming 650093, China
  • 2Department of Physics and Information Technology, Baoji University of Arts and Sciences, Baoji 721016, China
  • 3Key Laboratory of Advanced Materials of Yunnan Province, Kunming 650093, China
  • show less
    DOI: 10.3788/COL201715.081601 Cite this Article Set citation alerts
    Yushuang Qi, Lei Zhao, Wenjuan Bian, Xue Yu, Xuhui Xu, Jianbei Qiu. Energy transfer between Ce3+ and Sm3+ in Zn2GeO4 phosphor with the native defects for light-emitting diodes[J]. Chinese Optics Letters, 2017, 15(8): 081601 Copy Citation Text show less
    (a) XRD patterns of Zn1.99GeO4:0.01Sm3+, Zn1.96GeO4:0.04Ce3+, Zn1.95GeO4:0.04Ce3+, 0.01Sm3+, and the JCPDS card of Zn2GeO4 (No.11-0687), (b) XPS of Zn1.96GeO4:0.04Ce3+, and the inset is the enlargement of the XPS spectrum from 860 to 900 eV.
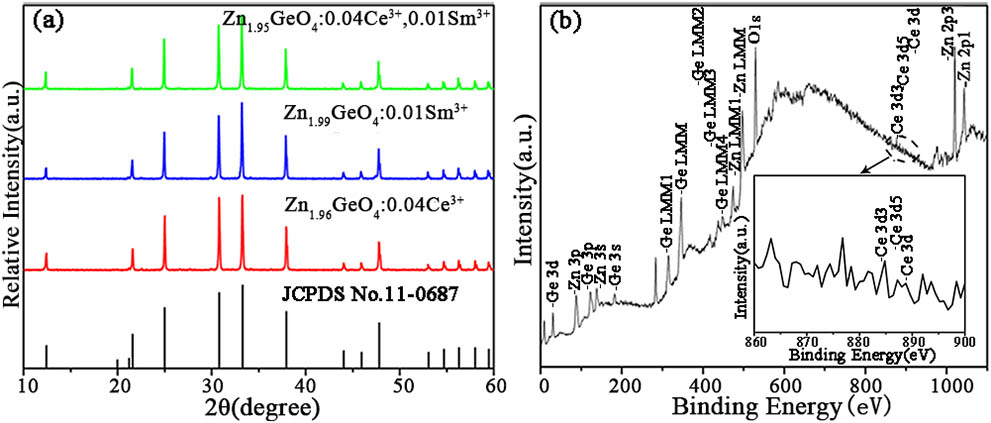
    Fig. 1. (a) XRD patterns of Zn1.99GeO4:0.01Sm3+, Zn1.96GeO4:0.04Ce3+, Zn1.95GeO4:0.04Ce3+, 0.01Sm3+, and the JCPDS card of Zn2GeO4 (No.11-0687), (b) XPS of Zn1.96GeO4:0.04Ce3+, and the inset is the enlargement of the XPS spectrum from 860 to 900 eV.
    (a) PLE and PL spectra of Zn2GeO4, (b) Zn1.99GeO4:0.01Sm3+, (c) Zn1.96GeO4:0.04Ce3+, and (d) Zn1.95GeO4:0.04Ce3+, 0.01Sm3+ samples, respectively.
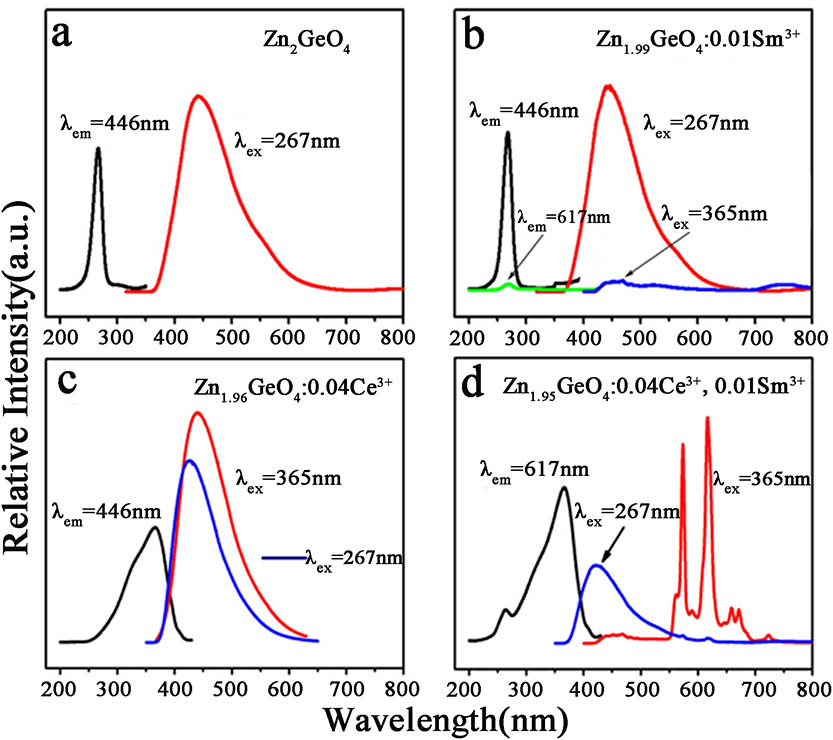
    Fig. 2. (a) PLE and PL spectra of Zn2GeO4, (b) Zn1.99GeO4:0.01Sm3+, (c) Zn1.96GeO4:0.04Ce3+, and (d) Zn1.95GeO4:0.04Ce3+, 0.01Sm3+ samples, respectively.
    (Color online) PLE spectrum of Zn1.99GeO4:0.01Sm3+ (black) and PL spectrum of Zn1.96GeO4:0.04Ce3+ (red).
    Fig. 3. (Color online) PLE spectrum of Zn1.99GeO4:0.01Sm3+ (black) and PL spectrum of Zn1.96GeO4:0.04Ce3+ (red).
    PL spectra of Zn1.99−xGeO4:xCe3+, 0.01Sm3+ (x=0.00, 0.01, 0.02, 0.03, 0.04, and 0.05) samples.
    Fig. 4. PL spectra of Zn1.99xGeO4:xCe3+, 0.01Sm3+ (x=0.00, 0.01, 0.02, 0.03, 0.04, and 0.05) samples.
    Decay curves of Zn1.96−yGeO4:0.04Ce3+, ySm3+ (y=0.00, 0.005, 0.03, and 0.07) monitored the 446 nm emission under 365 nm excitation.
    Fig. 5. Decay curves of Zn1.96yGeO4:0.04Ce3+, ySm3+ (y=0.00, 0.005, 0.03, and 0.07) monitored the 446 nm emission under 365 nm excitation.
    CIE chromaticity diagram of Zn1.96GeO4:0.04Ce3+ and Zn1.93GeO4:0.04Ce3+, 0.03Sm3+ phosphors.
    Fig. 6. CIE chromaticity diagram of Zn1.96GeO4:0.04Ce3+ and Zn1.93GeO4:0.04Ce3+, 0.03Sm3+ phosphors.
    Dependence of Is0/Is of Ce3+ on C6/3, C8/3, and C10/3.
    Fig. 7. Dependence of Is0/Is of Ce3+ on C6/3, C8/3, and C10/3.
    τ1 (ns)A1τ2 (ns)A2
    1.45591142.54313.207911.988
    1.25941178.25613.17239.651
    1.27631147.68211.59378.7932
    1.4221243.26811.27649.143
    Table 1. Decay Kinetics for Zn1.96−yGeO4:0.04Ce3+, ySm3+ (y=0.00, 0.005, 0.03, and 0.07) Phosphors
    Yushuang Qi, Lei Zhao, Wenjuan Bian, Xue Yu, Xuhui Xu, Jianbei Qiu. Energy transfer between Ce3+ and Sm3+ in Zn2GeO4 phosphor with the native defects for light-emitting diodes[J]. Chinese Optics Letters, 2017, 15(8): 081601
    Download Citation