
Jun Zheng, Han-Ping Hu. A novel method of constructing high-dimensional digital chaotic systems on finite-state automata[J]. Chinese Physics B, 2020, 29(9):
- Chinese Physics B
- Vol. 29, Issue 9, (2020)
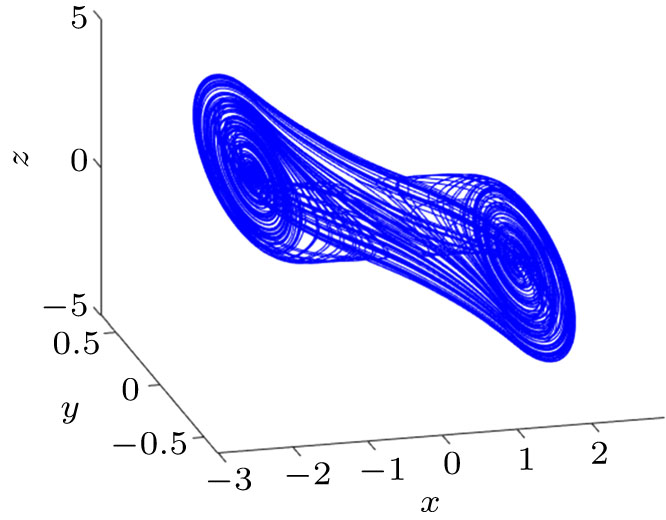
Fig. 1. Chaotic behavior of Chua chaotic system.
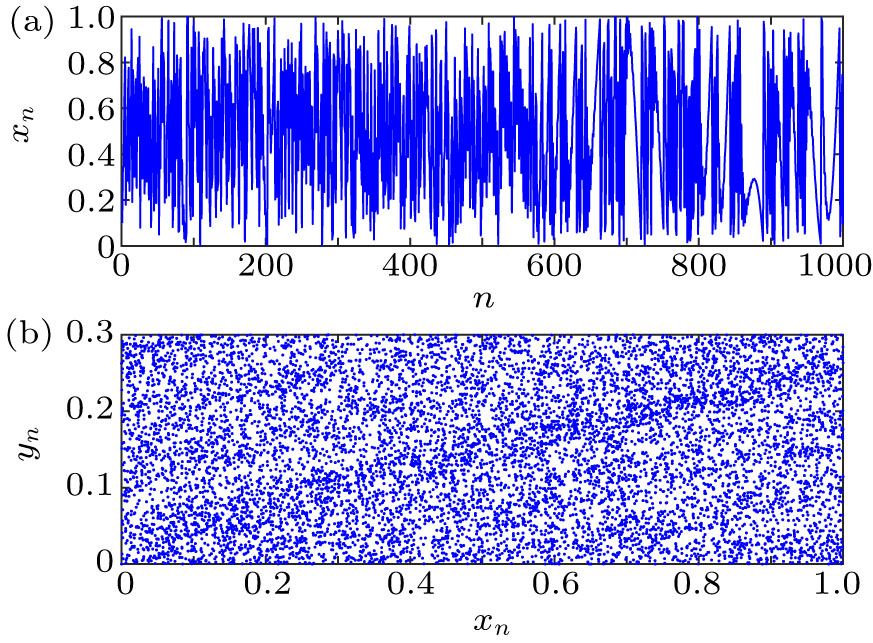
Fig. 2. (a) The trajectory of x -dimensional state of the controlled 2DLM. (b) The phase diagram of the controlled 2DLM.
Fig. 3. (a) Auto-correlation functions of x -dimensional output of the controlled 2DLM. (b) The frequency distribution of x -dimensional output of the controlled 2DLM.
Fig. 4. Phase diagrams of the controlled 2DLM with different control parameters λ .
Fig. 5. Recurrence plots of the controlled 2DLM (x -dimensional state) with different control parameters λ .
Fig. 6. Graphs of DET and LAM against different λ of the controlled 2DLM.
Fig. 7. Approximate entropy values of the controlled 2DLM (x -dimensional state) with different control parameters λ .
Fig. 8. (a) Bifurcation diagram and (b) Lyapunov exponent of the controlled 2DLM (x -dimensional state).
Fig. 9. The phase diagrams. Panels (a), (b), and (c) correspond to original Henon map, uncontrolled and controlled digital Henon maps.
Fig. 10. Auto-correlation functions. Panels (a), (b), and (c) correspond to original Henon map, uncontrolled and controlled digital Henon maps.
Fig. 11. The frequency distributions. Panels (a), (b), and (c) correspond to original Henon map, uncontrolled and controlled digital Henon maps.
Fig. 12. The approximate entropies of Henon map, digital Henon map, and controlled Henon map with different finite precisions P .
Fig. 13. Phase diagrams of the 4DLM: (a) x –y plane, (b) x –z plane, (c) x –v plane, (d) x –y –v space.
Fig. 14. (a) Auto-correlation functions of x -dimensional output of the controlled 4DLM. (b) The frequency distribution of x -dimensional output of the controlled 4DLM.
Fig. 15. Approximate entropy values of the controlled 4DLM with different control parameters λ .
Fig. 16. Flowchart of the PRNG.
Fig. 17. Linear complexity of the generated bit sequence.
|
Table 1. Results of NIST SP800-22 tests for test sequences.

Set citation alerts for the article
Please enter your email address
© Copyright 2018-2021 | Chinese Laser Press. All Rights Reserved 沪ICP备15018463号-20