• Chinese Journal of Lasers
  • Vol. 50, Issue 21, 2107104 (2023)
Xiaodong Sun1、2 and Yujiao Shi1、2、*
Author Affiliations
  • 1MOE Key Laboratory of Laser Life Science, College of Biophotonics, South China Normal University, Guangzhou 510631, Guangdong, China
  • 2Guangdong Provincial Key Laboratory of Laser Life Science, College of Biophotonics, South China Normal University, Guangzhou 510631, Guangdong, China
  • show less
    DOI: 10.3788/CJL230598 Cite this Article Set citation alerts
    Xiaodong Sun, Yujiao Shi. Temperature‑Responsive Phase‑Change AuNR@PNIPAM Nanoprobe for the Second Near‑Infrared Region Tumor‑Contrast Photoacoustic Imaging[J]. Chinese Journal of Lasers, 2023, 50(21): 2107104 Copy Citation Text show less
    Schematic illustration of the thermosensitive phase change nanoprobes AuNR@PNIPAM for dynamic contrast-enhanced photoacoustic imaging of tumors, where an external near-infrared optical stimulus (980 nm) dynamically modulates photoacoustic signals
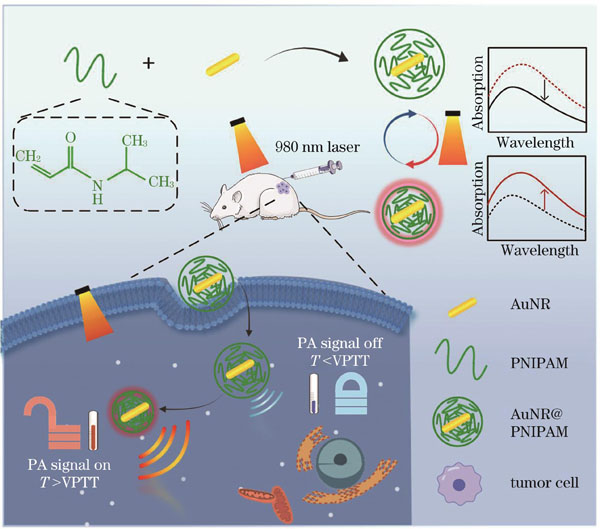
    Fig. 1. Schematic illustration of the thermosensitive phase change nanoprobes AuNR@PNIPAM for dynamic contrast-enhanced photoacoustic imaging of tumors, where an external near-infrared optical stimulus (980 nm) dynamically modulates photoacoustic signals
    Characterization of AuNR@PNIPAM microgels. (a) Feature of temperature-responsive size and morphology change of AuNR@PNIPAM microgels analyzed by TEM, the images are arranged from left to right and include: the photographs of AuNR@PNIPAM aqueous solution at different temperatures (50 ℃ and 25 ℃), TEM image of AuNR@PNIPAM microgels prepared at 50 ℃ and TEM image of AuNR@PNIPAM microgels prepared at 25 ℃; (b) hydrodynamic size of AuNR@PNIPAM microgels at different temperatures (50 ℃and 25 ℃) analyzed by DLS, the inset is Zeta potentials of AuNR and AuNR@PNIPAM; (c) absorption spectra of AuNR@PNIPAM microgels at different temperatures; (d) absorption at 1064 nm of AuNR@PNIPAM microgels varies with temperature; (e) reversibility in absorption of AuNR@PNIPAM microgels at 1064 nm during heating cycles above and below AuNR@PNIPAM microgels' phase transition midpoint
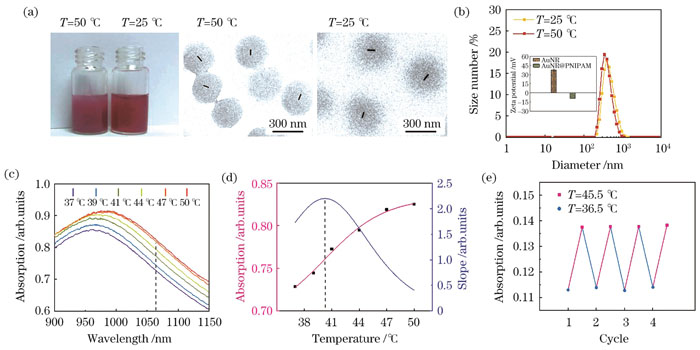
    Fig. 2. Characterization of AuNR@PNIPAM microgels. (a) Feature of temperature-responsive size and morphology change of AuNR@PNIPAM microgels analyzed by TEM, the images are arranged from left to right and include: the photographs of AuNR@PNIPAM aqueous solution at different temperatures (50 ℃ and 25 ℃), TEM image of AuNR@PNIPAM microgels prepared at 50 ℃ and TEM image of AuNR@PNIPAM microgels prepared at 25 ℃; (b) hydrodynamic size of AuNR@PNIPAM microgels at different temperatures (50 ℃and 25 ℃) analyzed by DLS, the inset is Zeta potentials of AuNR and AuNR@PNIPAM; (c) absorption spectra of AuNR@PNIPAM microgels at different temperatures; (d) absorption at 1064 nm of AuNR@PNIPAM microgels varies with temperature; (e) reversibility in absorption of AuNR@PNIPAM microgels at 1064 nm during heating cycles above and below AuNR@PNIPAM microgels' phase transition midpoint
    Temperature-responsive property of AuNR@PNIPAM microgels. (a) Peak to peak value projection of the photoacoustic signal of AuNR@PNIPAM microgels at different temperatures at the position of the solid line in Fig.3(c); (b) photoacoustic signal amplitude statistics of AuNR@PNIPAM microgels at different temperatures; (c) two-dimensional photoacoustic images of AuNR@PNIPAM microgels at different temperatures; (d) PA difference image of AuNR@PNIPAM microgels and AuNR samples ( 37 ℃ and 45 ℃)
    Fig. 3. Temperature-responsive property of AuNR@PNIPAM microgels. (a) Peak to peak value projection of the photoacoustic signal of AuNR@PNIPAM microgels at different temperatures at the position of the solid line in Fig.3(c); (b) photoacoustic signal amplitude statistics of AuNR@PNIPAM microgels at different temperatures; (c) two-dimensional photoacoustic images of AuNR@PNIPAM microgels at different temperatures; (d) PA difference image of AuNR@PNIPAM microgels and AuNR samples ( 37 ℃ and 45 ℃)
    Photothermal property of AuNR@PNIPAM microgels. (a) Temperature rise versus time for 1 mg/mL AuNR@PNIPAM microgels irradiated by 980 nm laser with different laser power densities; (b) temperature rise versus time for different mass concentrations of AuNR@PNIPAM microgels under 980 nm laser irradiation (1.5 W/cm2, 20 min); (c) photothermal stability of 1 mg/mL AuNR@PNIPAM microgels under 980 nm laser irradiation (1.5 W/cm2, 20 min); (d) photothermal images of subcutaneous tissue of mice injected with PBS or AuNR@PNIPAM (1 mg/mL) under 980 nm laser irradiation (1.5 W/cm2); (e) real-time recording of the temperature rise curve of subcutaneous tissue of mice injected with PBS or AuNR@PNIPAM (1 mg/mL) under 980 nm laser irradiation (1.5 W/cm2, 30 min)
    Fig. 4. Photothermal property of AuNR@PNIPAM microgels. (a) Temperature rise versus time for 1 mg/mL AuNR@PNIPAM microgels irradiated by 980 nm laser with different laser power densities; (b) temperature rise versus time for different mass concentrations of AuNR@PNIPAM microgels under 980 nm laser irradiation (1.5 W/cm2, 20 min); (c) photothermal stability of 1 mg/mL AuNR@PNIPAM microgels under 980 nm laser irradiation (1.5 W/cm2, 20 min); (d) photothermal images of subcutaneous tissue of mice injected with PBS or AuNR@PNIPAM (1 mg/mL) under 980 nm laser irradiation (1.5 W/cm2); (e) real-time recording of the temperature rise curve of subcutaneous tissue of mice injected with PBS or AuNR@PNIPAM (1 mg/mL) under 980 nm laser irradiation (1.5 W/cm2, 30 min)
    In vivo photoacoustic imaging verification of AuNR@PNIPAM microgels. (a) Schematic diagrams of photoacoustic imaging of subcutaneous tissue of mice injected with PBS, PNIPAM microgels and AuNR@PNIPAM microgels; (b) x-z tomography at the position of the corresponding dotted line in Fig.5(a), these photoacoustic images of mice with 30 min laser irradiation are arranged from left to right according to three experimental conditions: injection of PBS (980 nm laser on), PNIPAM (980 nm laser on), AuNR@PNIPAM (980 nm laser off) and AuNR@PNIPAM (980 nm laser on); (c) photoacoustic difference images of subcutaneous tissue of mice with injection of AuNR@PNIPAM under the conditions of 980 nm laser off or on; (d) peak to peak value projection of the photoacoustic signal amplitude at the position of the dotted line of subcutaneous tissue of mice with injection of AuNR@PNIPAM (980 nm laser on)
    Fig. 5. In vivo photoacoustic imaging verification of AuNR@PNIPAM microgels. (a) Schematic diagrams of photoacoustic imaging of subcutaneous tissue of mice injected with PBS, PNIPAM microgels and AuNR@PNIPAM microgels; (b) x-z tomography at the position of the corresponding dotted line in Fig.5(a), these photoacoustic images of mice with 30 min laser irradiation are arranged from left to right according to three experimental conditions: injection of PBS (980 nm laser on), PNIPAM (980 nm laser on), AuNR@PNIPAM (980 nm laser off) and AuNR@PNIPAM (980 nm laser on); (c) photoacoustic difference images of subcutaneous tissue of mice with injection of AuNR@PNIPAM under the conditions of 980 nm laser off or on; (d) peak to peak value projection of the photoacoustic signal amplitude at the position of the dotted line of subcutaneous tissue of mice with injection of AuNR@PNIPAM (980 nm laser on)
    In vitro cytotoxicity assay of AuNR@PNIPAM microgel. (a)(b) CCK-8 kit assays for cellular activity of HepG2 after co-incubation with different mass concentrations of AuNR@PNIPAM microgels for 12 h and 24 h; (c) H&E-stained images of different organs of mice after 1 d intravenous injection with PBS, AuNR@PNIPAM microgels (1 mg/mL, 980 nm laser off), and AuNR@PNIPAM (1 mg/mL, 980 nm laser on); (d) blood hematology analyses of healthy mice after 1 d of intravenous injection with PBS, AuNR@PNIPAM (1 mg/mL, 980 nm laser off), and AuNR@PNIPAM (1 mg/mL, 980 nm laser on) (RBC: red blood cells; WBC: white blood cells; HGB: haemoglobin; HCT: haematocrit; MCH: mean corpuscular hemoglobin; MCHC: mean corpuscular haemoglobin concentration; PLT: platelets; MPV:mean platelet volume); (e) serum biochemistry analyses of healthy mice after 1 d of intravenous injection with PBS, AuNR@PNIPAM (1 mg/mL, 980 nm laser off), and AuNR@PNIPAM (1 mg/mL, 980 nm laser on) (ALT: alanine transaminase; AST: aspartate transaminase; TP: total protein; ALB: albumin; GLOB: globulin; CR: creatinine; BUN: blood urea nitrogen; TBIL: total bilirubin)
    Fig. 6. In vitro cytotoxicity assay of AuNR@PNIPAM microgel. (a)(b) CCK-8 kit assays for cellular activity of HepG2 after co-incubation with different mass concentrations of AuNR@PNIPAM microgels for 12 h and 24 h; (c) H&E-stained images of different organs of mice after 1 d intravenous injection with PBS, AuNR@PNIPAM microgels (1 mg/mL, 980 nm laser off), and AuNR@PNIPAM (1 mg/mL, 980 nm laser on); (d) blood hematology analyses of healthy mice after 1 d of intravenous injection with PBS, AuNR@PNIPAM (1 mg/mL, 980 nm laser off), and AuNR@PNIPAM (1 mg/mL, 980 nm laser on) (RBC: red blood cells; WBC: white blood cells; HGB: haemoglobin; HCT: haematocrit; MCH: mean corpuscular hemoglobin; MCHC: mean corpuscular haemoglobin concentration; PLT: platelets; MPV:mean platelet volume); (e) serum biochemistry analyses of healthy mice after 1 d of intravenous injection with PBS, AuNR@PNIPAM (1 mg/mL, 980 nm laser off), and AuNR@PNIPAM (1 mg/mL, 980 nm laser on) (ALT: alanine transaminase; AST: aspartate transaminase; TP: total protein; ALB: albumin; GLOB: globulin; CR: creatinine; BUN: blood urea nitrogen; TBIL: total bilirubin)
    Xiaodong Sun, Yujiao Shi. Temperature‑Responsive Phase‑Change AuNR@PNIPAM Nanoprobe for the Second Near‑Infrared Region Tumor‑Contrast Photoacoustic Imaging[J]. Chinese Journal of Lasers, 2023, 50(21): 2107104
    Download Citation