• Photonics Research
  • Vol. 6, Issue 7, 713 (2018)
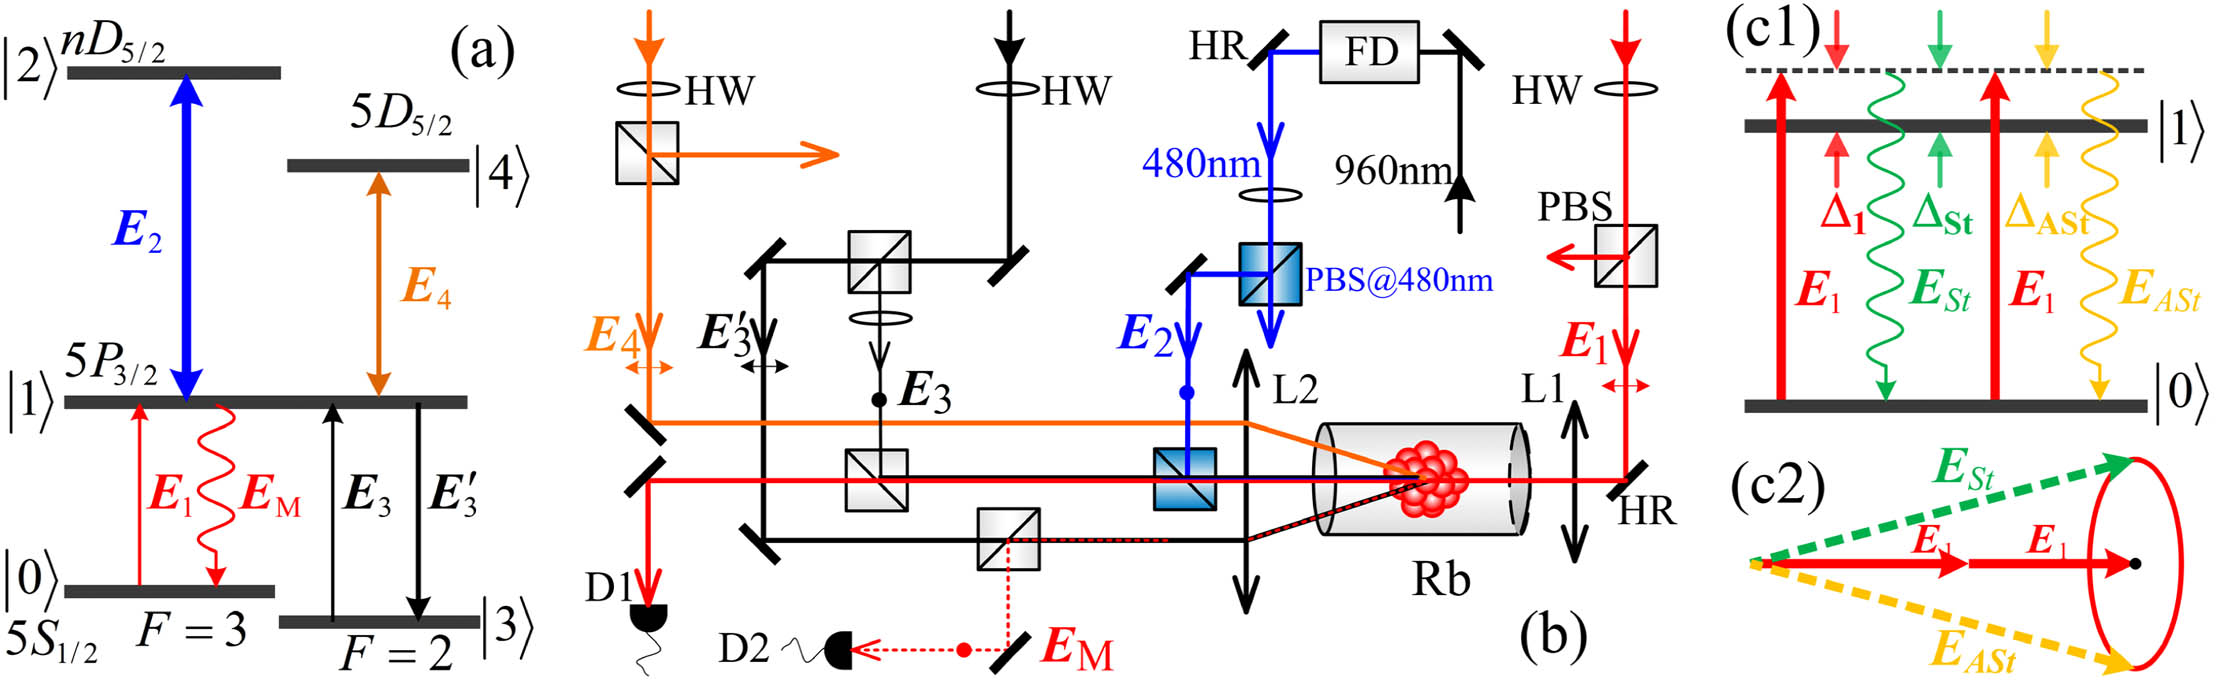
Zhaoyang Zhang1、†, Ji Guo1、†, Bingling Gu, Ling Hao, Gaoguo Yang, Kun Wang, and Yanpeng Zhang*
Author Affiliations
  • Key Laboratory for Physical Electronics and Devices of the Ministry of Education & Shaanxi Key Laboratory of Information Photonic Technique, Xi’an Jiaotong University, Xi’an 710049, China
  • show less
    DOI: 10.1364/PRJ.6.000713 Cite this Article Set citation alerts
    Zhaoyang Zhang, Ji Guo, Bingling Gu, Ling Hao, Gaoguo Yang, Kun Wang, Yanpeng Zhang. Parametric amplification of Rydberg six- and eight-wave mixing processes[J]. Photonics Research, 2018, 6(7): 713 Copy Citation Text show less
    (a) Five-level K-type energy level diagram depicting the generation of the MWM process in the Rb85 atomic system. (b) Experimental setup. D, photodetector; L, lens; PBS, polarized beam splitter at corresponding wavelength; FD, frequency doubler; HR, high-reflectivity mirror; HW, half-wave plate at corresponding wavelength. Transverse double-headed arrows and filled dots indicate the horizontal polarization and vertical polarization of incident beams, respectively. Five beams derived from the four laser systems are coupled into the 10 mm long Rb cell wrapped with μ-metal sheets. The transition |0⟩↔|1⟩ is coupled by the beam E1 (780.2 nm). Rydberg transition |1⟩↔|2⟩ is coupled by beam E2 (480 nm), which counterpropagates with beam E1. |1⟩↔|3⟩ is connected by beams E3 and E3′ (780.2 nm), which are derived from the same ECDL, and |1⟩↔|4⟩ is coupled by beam E4 (775.9 nm). The EIT signal and MWM spectrum signals are received by D1 and D2, respectively. (c1) Energy schematic diagram for SP-FWM process; (c2) phase-matching condition of SP-FWM process.
    Fig. 1. (a) Five-level K-type energy level diagram depicting the generation of the MWM process in the Rb85 atomic system. (b) Experimental setup. D, photodetector; L, lens; PBS, polarized beam splitter at corresponding wavelength; FD, frequency doubler; HR, high-reflectivity mirror; HW, half-wave plate at corresponding wavelength. Transverse double-headed arrows and filled dots indicate the horizontal polarization and vertical polarization of incident beams, respectively. Five beams derived from the four laser systems are coupled into the 10 mm long Rb cell wrapped with μ-metal sheets. The transition |0|1 is coupled by the beam E1 (780.2 nm). Rydberg transition |1|2 is coupled by beam E2 (480 nm), which counterpropagates with beam E1. |1|3 is connected by beams E3 and E3 (780.2 nm), which are derived from the same ECDL, and |1|4 is coupled by beam E4 (775.9 nm). The EIT signal and MWM spectrum signals are received by D1 and D2, respectively. (c1) Energy schematic diagram for SP-FWM process; (c2) phase-matching condition of SP-FWM process.
    (a1) Phase-matching diagram of the OPA process with ESWM1 injected into the Stokes port. (a2) Measured Stokes field ESt and (a3) anti-Stokes field EASt versus Δ1; (b1) and (b2) intensity of PA-SWM2 signals transited from nD5/2 versus Δ1 at different Δ2 for n=37 and n=54, respectively; (c1) and (c2) intensity of PA-SWM2 signals transited from fine structure of energy level nD3/2 versus Δ1 at different Δ2 for n=37 and n=54, respectively; (d1) PA-SWM1 signals (denoted as blue triangles) versus Δ1 at different Δ4 (Δ1+Δ4=0); (d2) PA-SWM2 signals transited from 37D5/2 (denoted as black squares) and 54D3/2 (denoted as red circles) versus Δ1 at different Δ2 (Δ1+Δ2+ϵ=0).
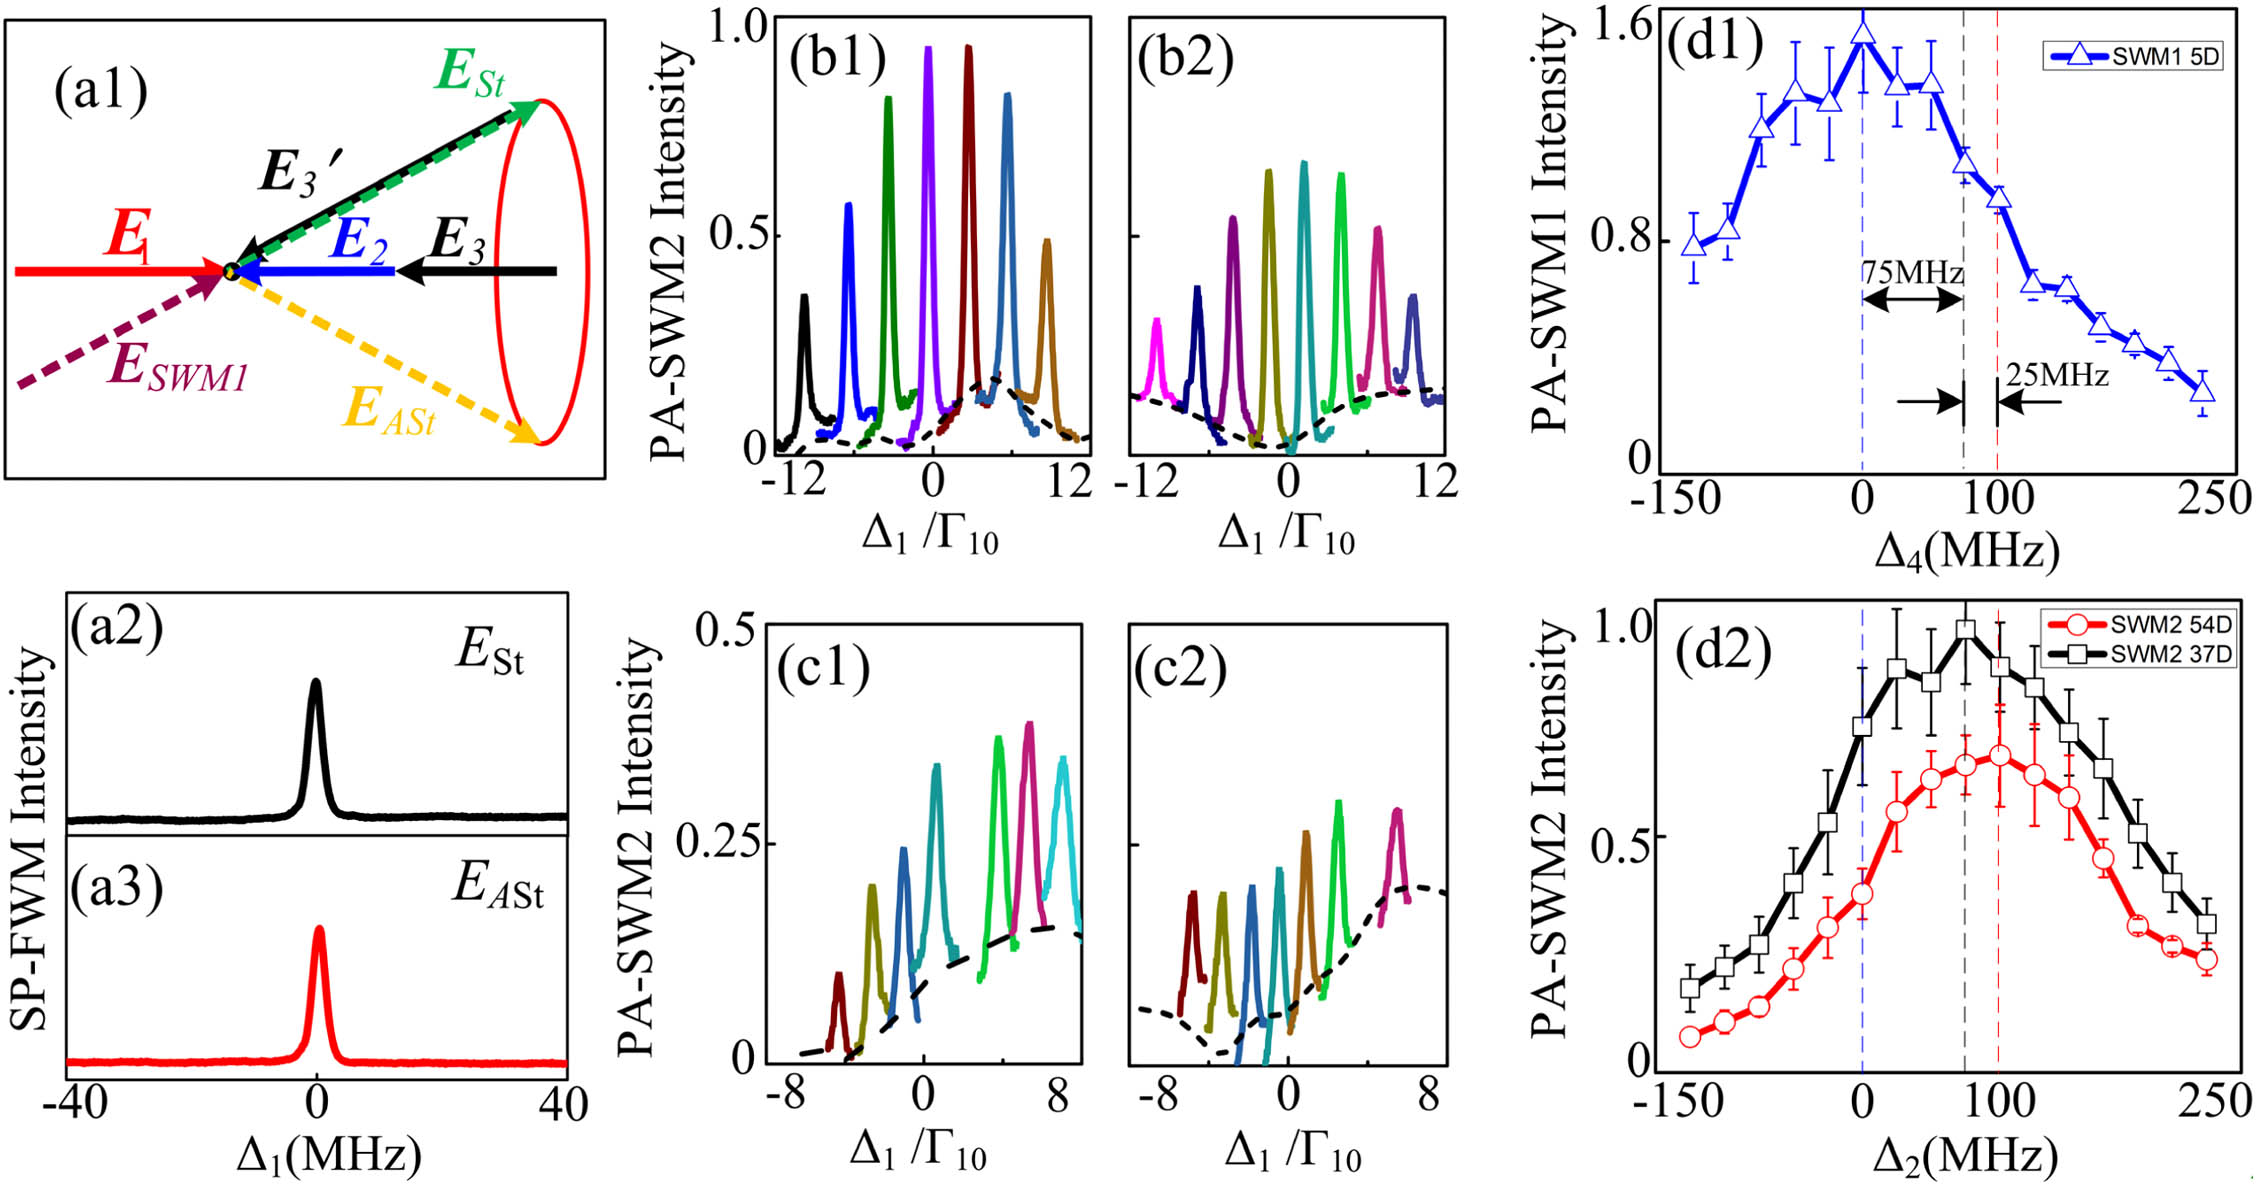
    Fig. 2. (a1) Phase-matching diagram of the OPA process with ESWM1 injected into the Stokes port. (a2) Measured Stokes field ESt and (a3) anti-Stokes field EASt versus Δ1; (b1) and (b2) intensity of PA-SWM2 signals transited from nD5/2 versus Δ1 at different Δ2 for n=37 and n=54, respectively; (c1) and (c2) intensity of PA-SWM2 signals transited from fine structure of energy level nD3/2 versus Δ1 at different Δ2 for n=37 and n=54, respectively; (d1) PA-SWM1 signals (denoted as blue triangles) versus Δ1 at different Δ4 (Δ1+Δ4=0); (d2) PA-SWM2 signals transited from 37D5/2 (denoted as black squares) and 54D3/2 (denoted as red circles) versus Δ1 at different Δ2 (Δ1+Δ2+ϵ=0).
    (a1) Measured PA-SWM2 signals versus Δ2 by increasing P2 for n=37; (a2) intensity dependence of the PA-SWM2 signals corresponding to (a1) on P2; (b1) measured PA-SWM2 signals versus Δ2 by changing the temperature for n=37; (b2) intensity dependence of the PA-SWM2 signals corresponding to (b1) on resonant condition on temperature; (b3) theoretically simulated PA-SWM2 signals to (b1). The dots indicate the experimental data, and the solid curve represents the theoretical simulation. The dashed lines are a guide for the eyes.
    Fig. 3. (a1) Measured PA-SWM2 signals versus Δ2 by increasing P2 for n=37; (a2) intensity dependence of the PA-SWM2 signals corresponding to (a1) on P2; (b1) measured PA-SWM2 signals versus Δ2 by changing the temperature for n=37; (b2) intensity dependence of the PA-SWM2 signals corresponding to (b1) on resonant condition on temperature; (b3) theoretically simulated PA-SWM2 signals to (b1). The dots indicate the experimental data, and the solid curve represents the theoretical simulation. The dashed lines are a guide for the eyes.
    (a1) AT splitting in the five-level atomic system induced by E2 and E4; (a2) phase-matching diagram of OPA injected with ESWM1, ESWM2, and EEWM into the Stokes port. (b) Measured MWM versus Δ2 with discrete Δ4 for n=37; the range of Δ4 is from −150 to 150 MHz. (c) Measured MWM signals versus Δ2 with increasing P4 for n=37; the range of P4 is from 10 to 18 mW.
    Fig. 4. (a1) AT splitting in the five-level atomic system induced by E2 and E4; (a2) phase-matching diagram of OPA injected with ESWM1, ESWM2, and EEWM into the Stokes port. (b) Measured MWM versus Δ2 with discrete Δ4 for n=37; the range of Δ4 is from 150 to 150 MHz. (c) Measured MWM signals versus Δ2 with increasing P4 for n=37; the range of P4 is from 10 to 18 mW.
    Zhaoyang Zhang, Ji Guo, Bingling Gu, Ling Hao, Gaoguo Yang, Kun Wang, Yanpeng Zhang. Parametric amplification of Rydberg six- and eight-wave mixing processes[J]. Photonics Research, 2018, 6(7): 713
    Download Citation