
Ze HE, Zhaohui CHONG, Yu YANG, Yannan ZHOU, Yi LIU. Evolutionary investment network and the emerging energy power in Central Asia: From the perspective of cross-border mergers and acquisitions[J]. Journal of Geographical Sciences, 2020, 30(11): 1849
- Journal of Geographical Sciences
- Vol. 30, Issue 11, 1849 (2020)
Abstract
Keywords
1 Introduction
Power is defined as the ability of an agent to influence others or potential to control others’ actions (
Driven by the zero-sum game theory of geopolitics in the early days, the principles of egoism were enshrined in the international energy scramble, which led to long-term chaos in the international order. Competition for the control of scarce resources is not a new phenomenon, and it has been a cause of conflict or war in history (
The emergence of new factors, such as the progress in science and technology, energy transition and international political objectives, has led to the change in the behavior of stakeholders from competition to cooperation (
Central Asia, in the heart of Eurasia, is becoming the new stage for the major global capital forces in recent years because of the geostrategic location in the context of energy resources, the relatively stable political ecology, the progress in economic reform and opening-up. According to reports, multinational energy enterprises from more than ten countries have gathered in Central Asia to carry out oil exploration and development, crude oil refining, sales and other activities (
This paper uses Central Asia as a case study to analyse the evolutionary characteristics of the energy M&A network. In addition, organization modes of cross-border M&A in the energy sector would also be identified, taking into consideration industrial chains and country differences. This study aims to provide a scientific basis for policy making to promote practical energy cooperation in Central Asia.
2 Literature review
2.1 What is power, and what is the energy power?
The word “power” is derived from “potestas” or “potenia” of Latin and originally meant ability. As an objective and widespread social existence, power has always been one of the key research objects of political science, sociology, law, and organizational behavior. Robert Russell, the British philosopher, defined the concept of power rigorously in
Some researchers argue that a careful consideration of the processes of “energy power” and its effects on the political landscape could offer new perspectives on the energy geopolitical research (
2.2 How was social power embedded in the cross-border M&A network?
According to the portfolio theory of investment-induced factors, directly induced factors of M&A are the basic motivation that triggers enterprises’ foreign investment, including the capital, labor, technology, and management and information (
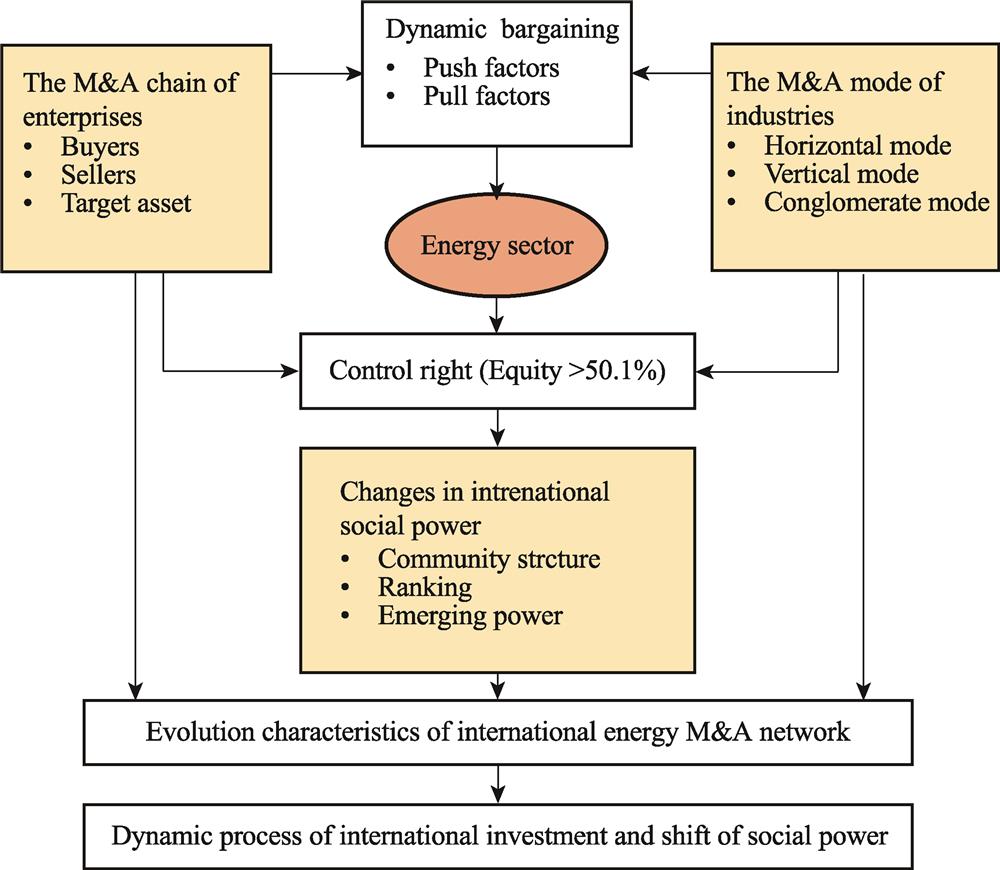
The energy sector has a unique industrial pattern and development path due to the scarcity, location fixation, and the natural territorial embeddedness of energy resources. Especially, the oil and gas sector is a typical producer-driven industry, which is the result of the powerful combination of privates, TNC, and state-owned enterprises for joint development (
Moreover, the essence of M&A is that the buyers aim to obtain strategic opportunities, exert synergies, and scope the economy. The realization of these goals is normally through the acquisition of ownership of the target asset (
![]()
Figure 1.
3 Materials and methods
3.1 Study area
Central Asia, located in the heart of Eurasia, is usually considered to consist of five countries: Kazakhstan, Turkmenistan, Uzbekistan, Tajikistan, and Kyrgyzstan (
![]()
Figure 2.
3.2 Data
Data on M&As were collected from the DealWatch database of the Emerging Markets Information Service (EMIS). The EMIS database is one of the authoritative data sources in research on enterprise mergers and acquisitions. It offers information on market dynamics and business information, and research reports of worldwide listed companies.
The process of sample selection is as follows. First, the M&As completed and Central Asian countries involved were selected from the DealWatch database. According to the International Standard Industrial Classification (ISIC), the enterprises were screened for M&A by sector for the energy industry, covering the extraction of oil and gas (211), coal mining industry (212), the manufacturing industry for refined oil (324), wholesale of petroleum and products (422), and electric power development (221). The third step is to split a transaction involving different countries into separate transactions. According to company law and securities law, the threshold for absolute control right of target assets transferred through equity transactions in cross-border M&A is 67%, while the threshold for relative control right of target assets transferred through equity transactions is 50.1%. To better describe the emerging energy power in cross-border M&A in Central Asia, this study strictly selected samples with target asset equity transactions greater than 50.1%. It is worth to note that the Central Asian countries headed by Kazakhstan did not own the energy industry completely until 2002. Therefore, we set the time period of this study from 2002 to 2016. As shown in
![]()
Figure 3.
3.3 Methods
This study applies the method of social networks. The main idea of social networks is to symbolize the relationship between the various parts of the system in the form of networks and to explore and show the correlation within the system (
![]()
Figure 4.
3.3.1 Overall characteristics
Stability. The increase and decrease in the number of countries/regions participating in the M&A network can reflect changes in its stability. According to the definition proposed by
where
Network density. That is the ratio between the numbers of exited connections and the numbers of theoretical maximum connections (complete graph) in the network. Assume the number of countries involved in the M&As is
Average path length. This is a concept in the network topology that is defined as the average number of steps along the shortest paths for all possible pairs of nodes. It is a measure of the efficiency of information or mass transport on a network.
Average clustering coefficient. That is the average probability of two nodes connected to the same node in the network. The clustering coefficient can reflect the degree of network aggregation. Let the aggregation coefficient of node
where
3.3.2 Nodes centrality
Centrality can be used to depict the role and importance of each country node in the network. Centrality in a directed network is divided into out-centrality and in-centrality, which represents the ability of the node from the perspective of sending and receiving a relationship respectively.
Degree. That includes out-degree and in-degree. As shown in formula (6) and (7),
Closeness. Closeness centrality (
Betweenness. That is a measure of brokerage or gatekeeping. The extent to which a particular point lies ‘between’ other points in the graph and how many shortest paths (geodesics) are there on it.
3.3.3 Community structure
The community structure of the social network refers to the network being composed of numbers of blocs. Each bloc shows a tight connection between nodes while connections between blocs are sparse. To explore the number, composition, and evolution of M&A blocs can provide a powerful explanation of the behavior of different countries/industries. The modularity proposed by Newman
where
4 Results
4.1 Evolution characteristics of international energy M&A network in Central Asia
4.1.1 The change in stability
The global financial crisis that occurred in 2008 had a profound impact on global energy M&A investment, which is consistent with the stability change of energy M&A network in the Central Asian market (
![]()
Figure 5.
4.1.2 The change in network complexity
Through a comparison of changes in network indicators in the three stages, we can examine the overall characteristic of the M&A network and its dynamic evolution. What can be seen in
| Stage (Time) | Network density | Average path length | Average clustering coefficient | Average degree |
|---|---|---|---|---|
| Pre-Recession (2002-2007) | 0.124 | 1.820 | 0.150 | 3.467 |
| Peak-Recession (2008-2011) | 0.065 | 1.790 | 0.062 | 2.723 |
| Post-Recession (2012-2016) | 0.066 | 1.792 | 0.048 | 2.500 |
Table 1.
Changes of indicators of energy M&A network in Central Asia
4.1.3 Correlation of degree-degree
The results of the correlation analysis of degree-degree in energy M&A network in Central Asia is given in
![]()
Figure 6.
4.2 Changes in community structure of energy M&A network and the importance ranking of countries
4.2.1 The changes in community structure
To better demonstrate the changes in community structure in the energy M&A network, countries in one bloc are represented by the same color (
![]()
Figure 7.
| Rank | Post-Recession (2002-2007) | Peak-Recession (2008-2011) | Past-Recession (2012-2016) | |||
|---|---|---|---|---|---|---|
| Country/region | Value | Country/region | Value | Country/region | Value | |
| 1 | KAZ | 9 | KAZ | 8 | CHN | 7 |
| 2 | RUS | 7 | PIS | 8 | KAZ | 5 |
| 3 | CHN | 7 | POL | 8 | RUS | 5 |
| 4 | PIS | 7 | CHN | 5 | PIS | 4 |
| 5 | USA | 6 | USA | 4 | MYS | 4 |
| 6 | CAN | 4 | VGB | 4 | HKG | 3 |
| 7 | GBR | 3 | GBR | 4 | FRA | 3 |
| 8 | NLD | 2 | RUS | 3 | GBR | 3 |
| 9 | POL | 1 | CHE | 2 | IRQ | 3 |
| 10 | KOR | 1 | KOR | 2 | USA | 2 |
Table 2.
Degree centrality of the top 10 countries (regions) in M&A network in Central Asia
4.2.2 The ranking of countries and the emerging power
The value of degree centrality could be used to measure the energy power since the degree centrality is an indicator representing the relative position and role of countries/regions in the M&A network. As shown in
After the collapse of the Soviet Union in 1992, the five Central Asian countries achieved independence one by one. At that time, China was still self-sufficient in energy and had little demand for foreign energy. It thus did not develop its international energy market well. Since 2002, the Central Asian market has been developed by the United States, the United Kingdom, the Netherlands, and other developed countries/regions. It is now difficult for China to enter the Central Asian market. As a result, it took a circuitous path, of buying relatively small and medium-sized energy companies, and scattered equity stakes from private sellers in Central Asia. After the Peak-Recession, the acquisition of energy assets by Chinese companies in Central Asia has continued to increase, and China’s energy power has increased significantly so that it even exceeds Kazakhstan.
4.3 The M&A modes of energy industries in Central Asia and various motivations
Furthermore, we counted and classified M&A relations in Central Asia over 2002-2016( We did not conduct a phased discussion in this section because the sample size is relatively small exclude the private sellers.). M&A modes could be summarized based on the upstream and downstream relations of the industrial chain. If M&A occurs between the same industries, it is defined as the horizontal mode. If M&A occurs between the industries with upstream and downstream connections, it is defined as a vertical mode. If M&A takes place in industries that are not directly related, it is defined as a conglomerate mode. For the classification, ISID code, and definitions of upstream and downstream of energy industries in this study, please refer to Appendix 2. There are different motivations and push-pull factors for different countries/regions participating in the Central Asian energy market (
![]()
Figure 8.
4.3.1 Horizontal mode
Horizontal mode occurred most frequently. The most frequent occurrence of horizontal M&A shows the flow of energy assets within the oil and gas industry, especially in the oil and gas extraction industry (211). The countries/regions involved in horizontal M&A can be divided into two categories. One is the combination of countries/regions formed by the sale of assets from Central Asian countries to other countries/regions. These countries include the United States, France, China, Russia, and Canada. From the perspective of Central Asian countries, it is mainly reflected in the pull factors of foreign investment including taxation, improvement of the political climate, and investment agreements between these countries. After attaining from the Soviet Republic, countries in Central Asia found themselves are a nation extremely rich with oil deposits but technologically unable to develop except to help for foreign investment (
The horizontal mode also involves those countries of non-Central Asian countries conduct energy asset transactions in Central Asia. These country or region combinations include the United Kingdom-Canada, the United States-the Netherlands, the United States-China, the United States-Russia, Russia-China, Russia-Russia, China-Canada, and Hong Kong (China)-Malaysia. The pursuit of resources, characteristics of industrial agglomeration, global economic competition, and market profitability are the main motivations for these countries to conduct M&A transactions. For example, European countries, including the Netherlands, France, Switzerland, Poland, Germany, and Bulgaria play important roles in the country’s development of the Central Asian energy market and their participation in obtaining more rights in energy trade.
4.3.2 Vertical mode
The vertical mode mainly observes in the upstream and downstream of the same industry. The main performances are the oil and gas exploitation industry (211) and its sub-industries, especially in the oil and gas industry, manufacturing in the refined petroleum industry (324), and wholesale of petroleum and products (422). Although vertical M&A does not occur as many times as the horizontal mode, the countries (regions) participating in vertical mode are most extensive. It is carried out between China-Hong Kong (China), the United States-Bulgaria, Kazakhstan-Ukraine; China-China and the United States-Poland, British Virgin Islands-Poland, Swiss-Poland, the United States-France, Germany-Poland, Poland-France, Poland-the Netherlands, and Kazakhstan-Poland. One of the possible explanations is that market share and profit targets are the main aims. Among them, some countries entered the Central Asian market earlier and have already started to operate the refined oil market in Central Asia.
In addition, vertical M&A also occurs in the other energy industries, mainly between the mining support industry (213), oil and gas extraction industry (211), electricity, gas and water supply (22), and coal mining industry (212). The cooperation countries are mainly British Virgin Islands-the United States, Kazakhstan-China, and Russia-Kazakhstan. Through the extension of the energy industrial chain, enhancing strategic influence may be one of the key considerations for these countries. Both the United States and Russia are major energy suppliers in the world. They need to achieve global strategy through the manipulation of the energy market in Central Asia. International relationship and geographical proximity are other important factors affecting the scale of factor flow. The closer countries are, the lower the transportation cost of factor flow is, and the greater is the possibility of flow. This is true for Russia and Ukraine. However, historical and cultural factors are superimposed on the pursuit of interest, and the Central Asian countries/regions and Russia have formed a complex mixture of emotions and interests. From the perspective of China, as the biggest energy demand country on the globe, the relative intensity of energy demand is an important driver of energy development in Central Asia. China’s energy consumption, especially in industrial energy consumption, promotes the expansion of its external energy market.
4.3.3 Conglomerate mode
In addition, a small amount of conglomerate M&A was also observed, financial cooperation is the most important motivations for the Conglomerate mode. Specifically, India-Russia, Kyrgyzstan-UK, and Kazakhstan-Russia mainly focused on investment in the oil and gas industry by public management and enterprise management services. St. Vincent and the Grenadines-the United Kingdom, the United Kingdom-Kazakhstan and the United Kingdom-China are mainly devoted to the development of financial investment activities such as investment banks and fund trusts in the oil and gas industry. Although there are other possibilities for Bulgaria, the main objective of the British Virgin Islands and Hong Kong of China is a capital orientation for their acting in the energy market in Central Asia, while St. Vincent and the Grenadines, the United Kingdom, and China are committed to the development of investment bank, fund trusts, and other financial investment activities in the oil and gas industry. This reflects the financial capital investment in this area. Specifically, India, Russia, and the United Kingdom focus on investment in public management and business management in the oil and gas industry. Some countries have begun developing diversified industrial embeddedness as they acquire resources by taking advantage of geographical and institutional proximities. For example, LG, a famous company from South Korea, has a wide range of operations in Central Asia and is widely respected and praised in this region.
5 Conclusions and discussion
5.1 Conclusions
This paper explores the social power change in Central Asia from the perspective of cross-border M&A, by using the social network method. The main results are as follows:
(1) The global financial crisis in 2008 has a profound impact on global energy M&A investment, which is consistent with the stability change of energy M&A network in the Central Asian market. The complexity of the energy M&A network in Central Asia has significantly decreased since the financial crisis in 2008.
(2) The correlation coefficient between out-degree and degree continued to decrease from 0.692 to 0.309, which indicates that the effect of out-degree is weakening for energy power. On the contrary, energy M&A is indeed an important way to enhance energy power for buyer countries. The correlation coefficient of betweenness and degree is 0.597 before the financial crisis in 2008, and its value increased to 0.63 after the financial crisis, so betweenness centrality is becoming the most significant factor affecting energy power.
(3) Changes in community structure reflect that multilateral competition and cooperation is the basis for shaping energy pattern in Central Asia. There are 3-5 groups in the Central Asian energy M&A network in 2002-2007, 2008-2011, and 2012-2016. The increasing numbers of blocs reflect the growth number of power blocs participating in energy development and investment in Central Asia. Multilateral cooperation and competition between Kazakhstan, Russia, and the United States is the leading factor in the power pattern before the financial crisis in 2008. After the financial crisis in 2008, other countries in Central Asia, such as Turkmenistan, Uzbekistan, and Kyrgyzstan, also tried to enrich the type and scope of their energy business.
(4) Kazakhstan is the most powerful energy country in Central Asia, while Russia and the United States have played an important role in the disposal of energy assets. The importance of East Asian countries and regions is on the rise. The acquisition of energy assets by Chinese companies in Central Asia has continued to increase, and China’s energy power has increased significantly after the Peak-Recession so that it even exceeds Kazakhstan. China’s investment in Central Asia pursues long-term benefits of strategic opportunities rather than short-term profits.
(5) M&A modes could be summarized based on the upstream and downstream relations of the industrial chain. Horizontal M&A is mainly reflected in the pull factors of foreign investment including taxation, improvement of the political climate, and investment agreements between these countries and Central Asian countries. The most frequent occurrence of horizontal M&A shows the flow of energy assets within the oil and gas industry, especially in the oil and gas exploitation industry (211). The vertical mode mainly observes the upstream and downstream of the same industry. Although vertical M&A does not occur as many times as the horizontal mode, the countries participating in vertical mode are most extensive. One of the possible explanations is that market share and profit targets become their main aims. A small amount of conglomerate M&A also observed financial cooperation is the most important motivation for the Conglomerate mode.
5.2 Discussion
This study shows that the Central Asian countries and China are the emerging energy powers in the Central Asiam region. To ensure lasting cooperation between the two parties and further promote mutually beneficial interests, our pieces of advice are shown as follows:
(1) It is important to promote the establishment of a practical and efficient multilateral energy cooperation mechanism. On the one hand, multilateral competition led by big powers has been the key force shaping the energy pattern in Central Asia over the past years. The energy game among Russia and the United States are the traditional leading power shaping the geopolitical pattern. China and Central Asian countries are the emerging power. Other countries/regions, such as the European Union, the United Kingdom, Malaysia, South Korea, India, Canada, and Ukraine have also intervened in Central Asian affairs in different channels to achieve their respective strategical goals. On the other hand, historical experience shows that establishing a practical and efficient multilateral energy cooperation mechanism can effectively help maintain regional energy security and yield collective benefits for the participating countries/regions. It is noted that the framework and agreement of the relevant international energy cooperation in Central Asia are mostly principled, and there is still no substantial energy cooperation framework. Therefore, energy cooperation consultation could be strengthened to form a practical and binding multilateral energy cooperation mechanism under the basic framework of the Belt and Road Initiative in the future.
(2) It is important to strengthen the integrated cooperation mode of the manufacturing industrial development and energy trade. At present, the trade model between China and the Central Asian countries/regions are mainly based on products in exchange for resources. However, this model is not conducive to long-term strategic cooperation and may even increase the possibility of conflicts of interest between the two sides. Most Central Asian countries implement a kind of resource economy with a single heavy industry and a low-level manufacturing industry. Due to the weak manufacturing industry, most of the products are required by Central Asian countries are imported, such as those in the chemical industry, construction, metallurgy, aviation, machinery, and household appliances. Nowadays, Central Asian countries are committed to building and improving their industrial systems. They need foreign technology to support the construction of industrial infrastructure. Therefore, economic ties between China and Central Asian countries can be further stabilized in the future by further strengthening the integrated cooperation of the manufacturing industrial development and energy trade.
(3) It is important to increase the diversity of financial services to support the economic development of Central Asian countries. Financial and capital cooperation can significantly promote the establishment of long-term benefit-sharing mechanisms involving Central Asian countries, China, and other countries to maintain long-term strategic cooperative relations. At present, policy development banks, i.e., China Development Bank and the Export-Import Bank of China are the main financial institutions participating in energy cooperation in Central Asia with the method of “loan for resources”. Some researchers pointed out that China’s global loan unprincipled have increased the debt crisis to these countries (
This paper has explored the energy power change in Central Asia based on the social network from the perspective of cross-border M&A. We need to explain again that the energy power studied in this paper is the emerging power generated and transferred in the M&A process rather than the power in the existing investments and greenfield incitements. Therefore, the results are different from the status in Central Asian energy affairs. Furthermore, the number of relations of energy M&A network used in the study was limited because of the difficulty of data acquisition. So, more abundant data and detailed empirical cases should be used in future studies to investigate the dynamic process of cross-border M&A. Lastly, the quadratic assignment procedure (QAP) methods and the Exponential Random Graph Model (ERGM) could be good options to obtain the quantified evaluation mechanism.
Acknowledgements
We are very grateful to Dr. Dongmiao Zhang of Utrecht University and Dr. Lisa He of the University of Hong Kong for their valuable comments and suggestions on this manuscript.
References
[1] BimpikisK, EhsaniS, Ilkili?R. Cournot competition in networked markets. Management Science, 65, 2467-2481(2019).
[2] BoH. Oil and Security(1976).
[3] BonannoA, RussoC, MenapaceL. Market power and bargaining in agri-food markets: A review of emerging topics and tools. Agribusiness, 34, 6-23(2018).
[4] BoschmaR, MarrocuE, PaciR. Symmetric and asymmetric effects of proximities: The case of M&A deals in Italy. Journal of Economic Geography, 16, 505-535(2016).
[5] BreulM, DiezJ R. An intermediate step to resource peripheries: The strategic coupling of gateway cities in the upstream oil and gas GPN. Geoforum, 92, 9-17(2018).
[6] BreulM, RevillaD, SambodoM. Filtering strategic coupling: Territorial intermediaries in oil and gas global production networks in Southeast Asia. Journal of Economic Geography, 19, 829-851(2019).
[7] BridgeG. Mapping the terrain of time-space compression: Power networks in everyday life. Environment and Planning D: Society and Space, 15, 611-626(1997).
[8] BridgeG. Global production networks and the extractive sector: Governing resource-based development. Journal of Economic Geography, 8, 389-419(2008).
[9] BridgeG, BradshawM. Making a global gas market: Territoriality and production networks in liquefied natural gas. Economic Geography, 93, 215-240(2017).
[10] CastellsM. The Rise of the Network Society: With a New Preface. New Jersey:. Wiley-Blackwell(2010).
[11] CastellsM. Grassrooting the space of flows. Urban Geography, 20, 294-302(1999).
[12] DanielY, 2009. The Prize: The Epic Quest for Oil, Money and Power. London: Free Press.
[13] DiG M C, MarrocuE, PaciR. The concurrent impact of cultural, political, and spatial distances on international mergers and acquisitions. The World Economy, 39, 824-852(2016).
[14] DickenP. Global Shift: Mapping the Changing Contours of the World Economy. London:. SAGE Publications Ltd(2007).
[15] DickenP, ThriftN. The organization of production and the production of organization: Why business enterprises matter in the study of geographical industrialization. Transactions of the Institute of British Geographers, 17, 279-291(1992).
[16] DunningJ H, LundanS M. Multinational Enterprises and the Global Economy(2008).
[17] EllwangerN, BoschmaR. Who acquires whom? The role of geographical proximity and industrial relatedness in Dutch domestic M&A between 2002 and 2008. Tijdschrift voor Economische en Sociale Geografie, 106, 608-624(2015).
[18] EmersonR M. Power-dependence relations. American Sociological Review, 27, 31-41(1962).
[19] EngdahlF W. A Century of War: Anglo-American Oil Politics and the New World Order(2004).
[20] EngdahlF W. Syria, Turkey, Israel and the Greater Middle East Energy War. Global Research. Centre for Research on Globalization, 11(2012).
[21] FoucaultM. Power: The Essential Works of Michel Foucault 1954-1984. London: Penguin(2019).
[22] FrenchJ, RavenB, CartwrightD. The bases of social power. Classics of Organization Theory, 7, 311-320(1959).
[23] GaoC D, GuoQ Q, JiangD et al. Theoretical basis and technical methods of cyberspace geography. Journal of Geographical Sciences, 29, 1949-1964(2019).
[24] GopalS, PittsJ, LiZ et al. Fueling global energy finance: The emergence of China in global energy investment. Energies, 11, 1-25(2018).
[25] GrewalD S. Network Power: The Social Dynamics of Globalization(2008).
[27] GuanQ Y, HeF. China’s energy security and international energy cooperation. World Economy and Politics, 45-53(2007).
[28] HeZ, YangY, LiuY et al. Evolution characteristics of global energy trading network and relationships between major countries. Progress in Geography, 38, 1621-1632(2019).
[30] HuangM, XiaoX. The legal issues and countermeasures of China’s investment in Central Asia. Journal of Changsha University of Science & Technology (Social Science), 31, 160-166(2016).
[31] IbarraH, AndrewsS B. Power, social influence, and sense making: Effects of network centrality and proximity on employee perceptions. Administrative Science Quarterly, 277-303(1993).
[32] KangueehiN C. Mergers and acquisitions as a strategy for business growth: A comparative overview [D]. Cape Town, South Africa: University of the. Western Cape(2015).
[33] KaplanS B. The rise of patient capital: The political economy of Chinese global finance. Available at SSRN 3108215(2018).
[34] KeohaneR O, NyeJ S. Power and interdependence. Survival, 15, 158-165(1973).
[35] KeohaneR O, NyeJ S. Globalization: What’s new? What’s not? (And so what?). Foreign Policy, 118, 104-119(2000).
[36] KlareM. Resource Wars: The New Landscape of Global Conflict. Boston:. Holt Paperbacks(2002).
[37] KongB. Oil power: A new perspective of oil geopolitics. Beijing: China Foreign Affairs University(2013).
[38] KouZ. New pattern of oil and gas resources export in Central Asia. International Oil Economy, 18, 39-47(2010).
[39] LiH Q, WangL M, LangY H. Evolution process and driving mechanism of energy geopolitical pattern. World Regional Studies, 18, 56-65(2009).
[40] LiZ, OuyangD. The cooperation and development of oil and gas resources in Central Asia and energy security of China. Finance & Economics of Xinjiang, 61-66(2008).
[41] LiangY T, ZhouZ K, LiuYi. Location choices of Chinese enterprises in Southeast Asia: The role of overseas Chinese networks. Journal of Geographical Sciences, 29, 1396-1410(2019).
[42] MannM. The Sources of Social Power, Vol.3, Global Empires and Revolution, 1890-1945(2012).
[43] ManningR. The Asian Energy Factor: Myths and Dilemmas of Energy, Security and the Pacific Future. New York: Palgrave(2000).
[44] MaoH Y. Prospects of energy cooperation of China with Russia and Central Asian countries. Progress in Human Geography, 32, 1433-1443(2013).
[45] MelvinAC, FernR G. The Geopolitics of Energy(1978).
[46] MoranT H. Multinational Corporations and the Politics of Dependence: Copper in Chile(2014).
[47] NyeJ S, WelchD A. Understanding Global Conflict & Cooperation: Introduction to Theory & History. Pearson Education(2014).
[48] PallaG, BarabásiA L, VicsekT. Quantifying social group evolution. Nature, 446, 664-667(2007).
[49] PengP, PoonJ P, YangY et al. Global oil traffic network and diffusion of influence among ports using real time data. Energy, 172, 333-342(2019).
[50] PengP, YangYCheng S et al.. Hub-and-spoke structure: Characterizing the global crude oil transport network with mass vessel trajectories. Energy, 168, 966-974(2019).
[51] PengP, YangY, LuF et al. Modelling the competitiveness of the ports along the Maritime Silk Road with big data. Transportation Research Part A: Policy and Practice, 118, 852-867(2018).
[52] PhilipS L. Oil Geopolitics(2008).
[53] PrinceJ T, SimonD H. The impact of mergers on quality provision: Evidence from the airline industry. The Journal of Industrial Economics, 65, 336-362(2017).
[54] QiuL, FangC L. Study on the spatial agglomeration of producer services and urban development. Economic Geography, 32, 76-80(2012).
[55] ReddyK S, XieE. Cross-border mergers and acquisitions by oil and gas multinational enterprises: Geography-based view of energy strategy. Renewable and Sustainable Energy Reviews, 72, 961-980(2017).
[56] RussellB. Power: A New Social Analysis. London: Routledge(2004).
[57] SongZ Y, CheS Y, YangY. The trade network of the Belt and Road Initiative and its topological relationship to the global trade network. Journal of Geographical Sciences, 28, 1249-1262(2018).
[58] SumN L. The intertwined geopolitics and geoeconomics of hopes/fears: China’s triple economic bubbles and the One Belt One Road imaginary. Territory, Politics, Governance, 7, 528-552(2019).
[59] TordoS. National Oil Companies and Value Creation. Washington, D.C.:. World Bank Group(2011).
[61] WangN Q. Age of Oil(2019).
[62] WeberM. From Max Weber: Essays in Sociology. London: Routledge(2013).
[64] XuJ H. Oil power: The core of oil geopolitics. World Economy and Politics, 115-132(2012).
[65] XuQ H. China’s global energy strategy: From energy strength to energy power. People’s Forum· Academic Frontiers, 62-68(2017).
[66] YangL. Development status of oil and gas resources in Central Asia countries. Russian, Central Asian and Eastern European Market, 14-18(2006).
[68] YangY, HeZ, LiuY. Global energy cooperation Between China and Central Asia: Current situation, risks, and countermeasures. Bulletin of Chinese Academy of Sciences, 33, 575-584(2018).
[69] YangY, LiuY, JinF J. Study on energy cooperation between China and the Central Asia and Russia under the view of energy geopolitics. Geographical Research, 34, 213-224(2015).
[70] YuJ H. World Energy Politics and China’s International Energy Cooperation(2011).
[72] ZhaoY B, FangC L. Analysis on pattern and prospect of the cooperation of oil and gas resources between China and Central Asia. World Regional Studies, 23, 29-36(2014).


Set citation alerts for the article
Please enter your email address

© Copyright 2018-2021 | Chinese Laser Press. All Rights Reserved 沪ICP备15018463号-20