• High Power Laser Science and Engineering
  • Vol. 4, Issue 1, 010000e2 (2016)
Ming-hai Yu1、2, Guang-yue Hu1, Ning An3, Feng Qian2, Yu-chi Wu2, Xiao-ding Zhang1, Yu-qiu Gu2, Qiu-ping Wang3, and Jian Zheng1
Author Affiliations
  • 1Department of Modern Physics & CAS Key Laboratory of Geospace Environment, University of Science and Technology of China, Hefei, Anhui 230026, China
  • 2Research Center of Laser Fusion, China Academy of Engineering Physics, Mianyang 621900, China
  • 3National Synchrotron Radiation Laboratory, University of Science and Technology of China, Hefei, Anhui 230026, China
  • show less
    DOI: 10.1017/hpl.2015.36 Cite this Article Set citation alerts
    Ming-hai Yu, Guang-yue Hu, Ning An, Feng Qian, Yu-chi Wu, Xiao-ding Zhang, Yu-qiu Gu, Qiu-ping Wang, Jian Zheng. Hard x-ray transmission curved crystal spectrometers (10–100 keV) for laser fusion experiments at the ShenGuang-III laser facility[J]. High Power Laser Science and Engineering, 2016, 4(1): 010000e2 Copy Citation Text show less
    Cauchois-geometry optics of a symmetry transmission cylindrical curved crystal.
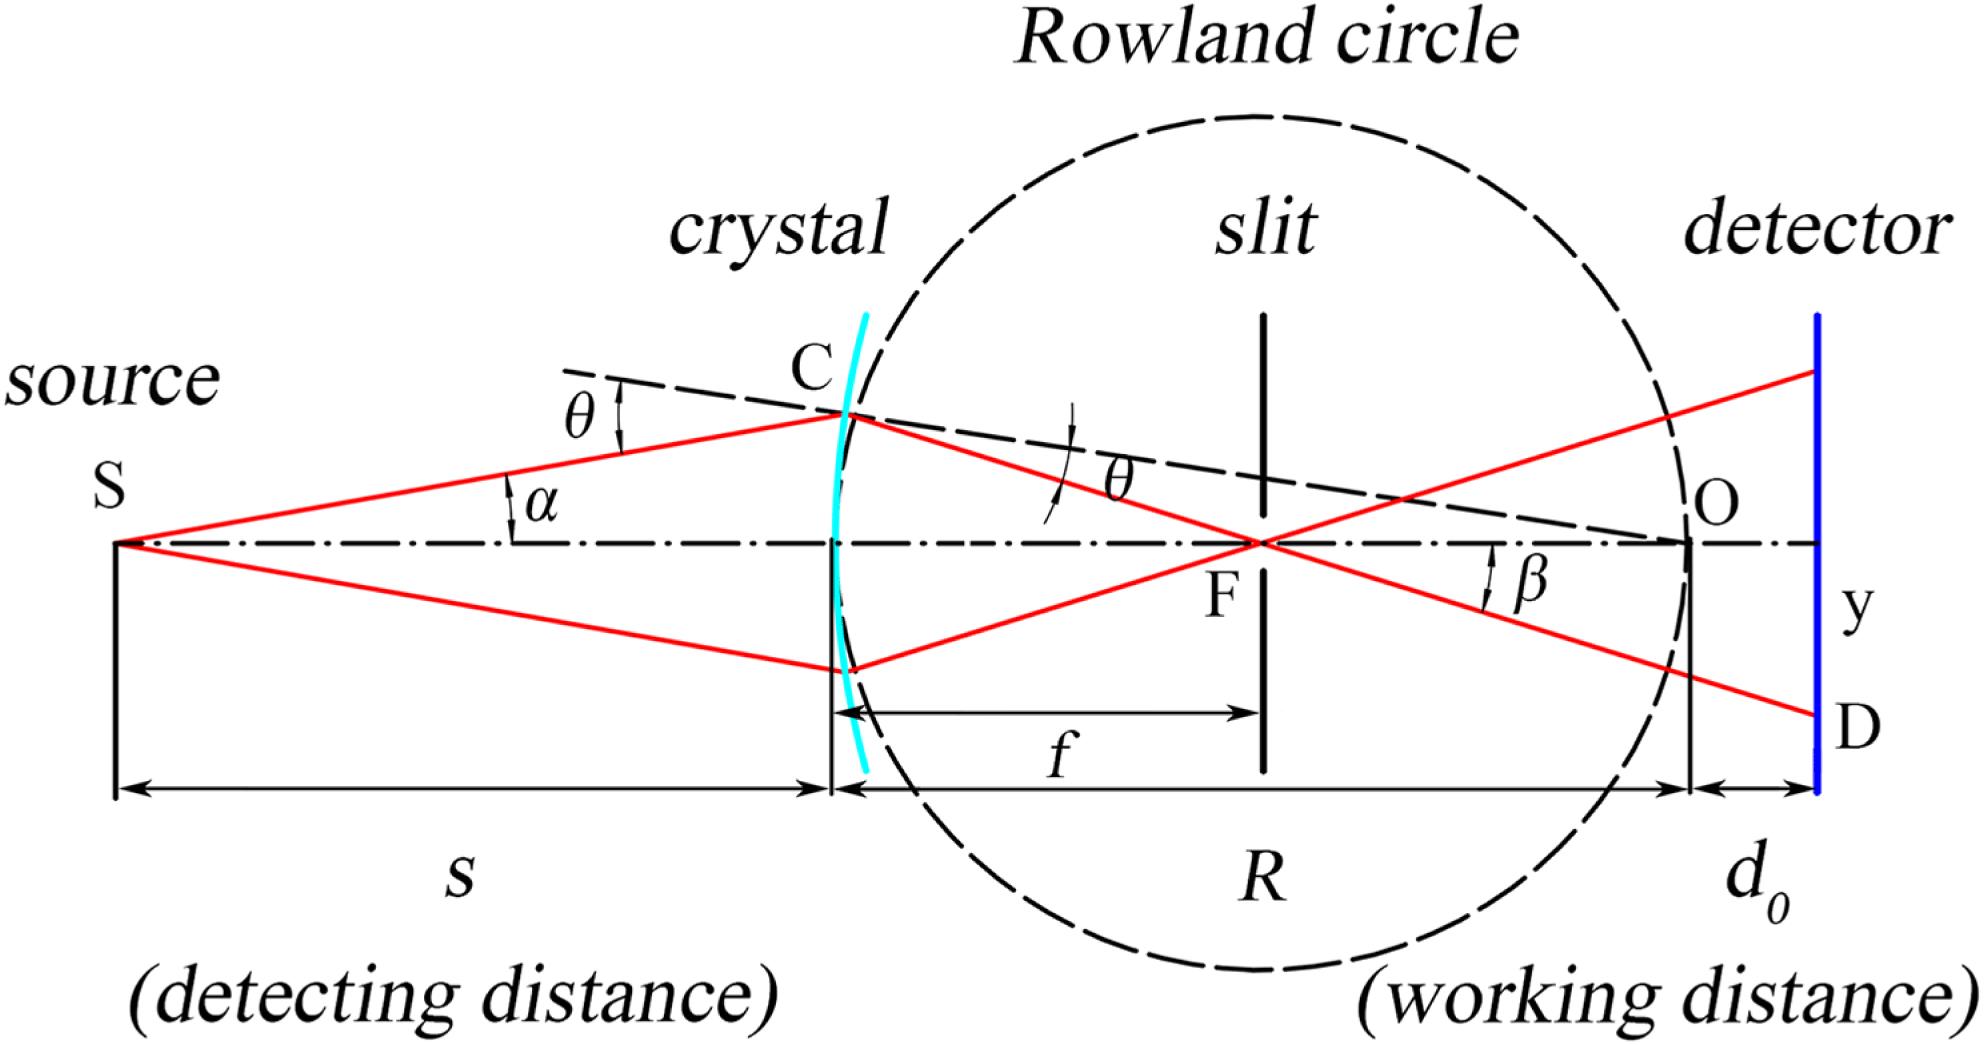
    Fig. 1. Cauchois-geometry optics of a symmetry transmission cylindrical curved crystal.
    (Solid lines) the position of the slit $f$ versus the detecting distance $s$ (the source-to-crystal distance) of the 17.48 keV Mo K${\it\alpha}_{1}$ x-ray. (Dash lines) the position of the slit $f$ versus the x-ray photon energy at a fixed detecting distance, $s$, of 500 mm. The crystals’ curvature radii are 150 and 300 mm.
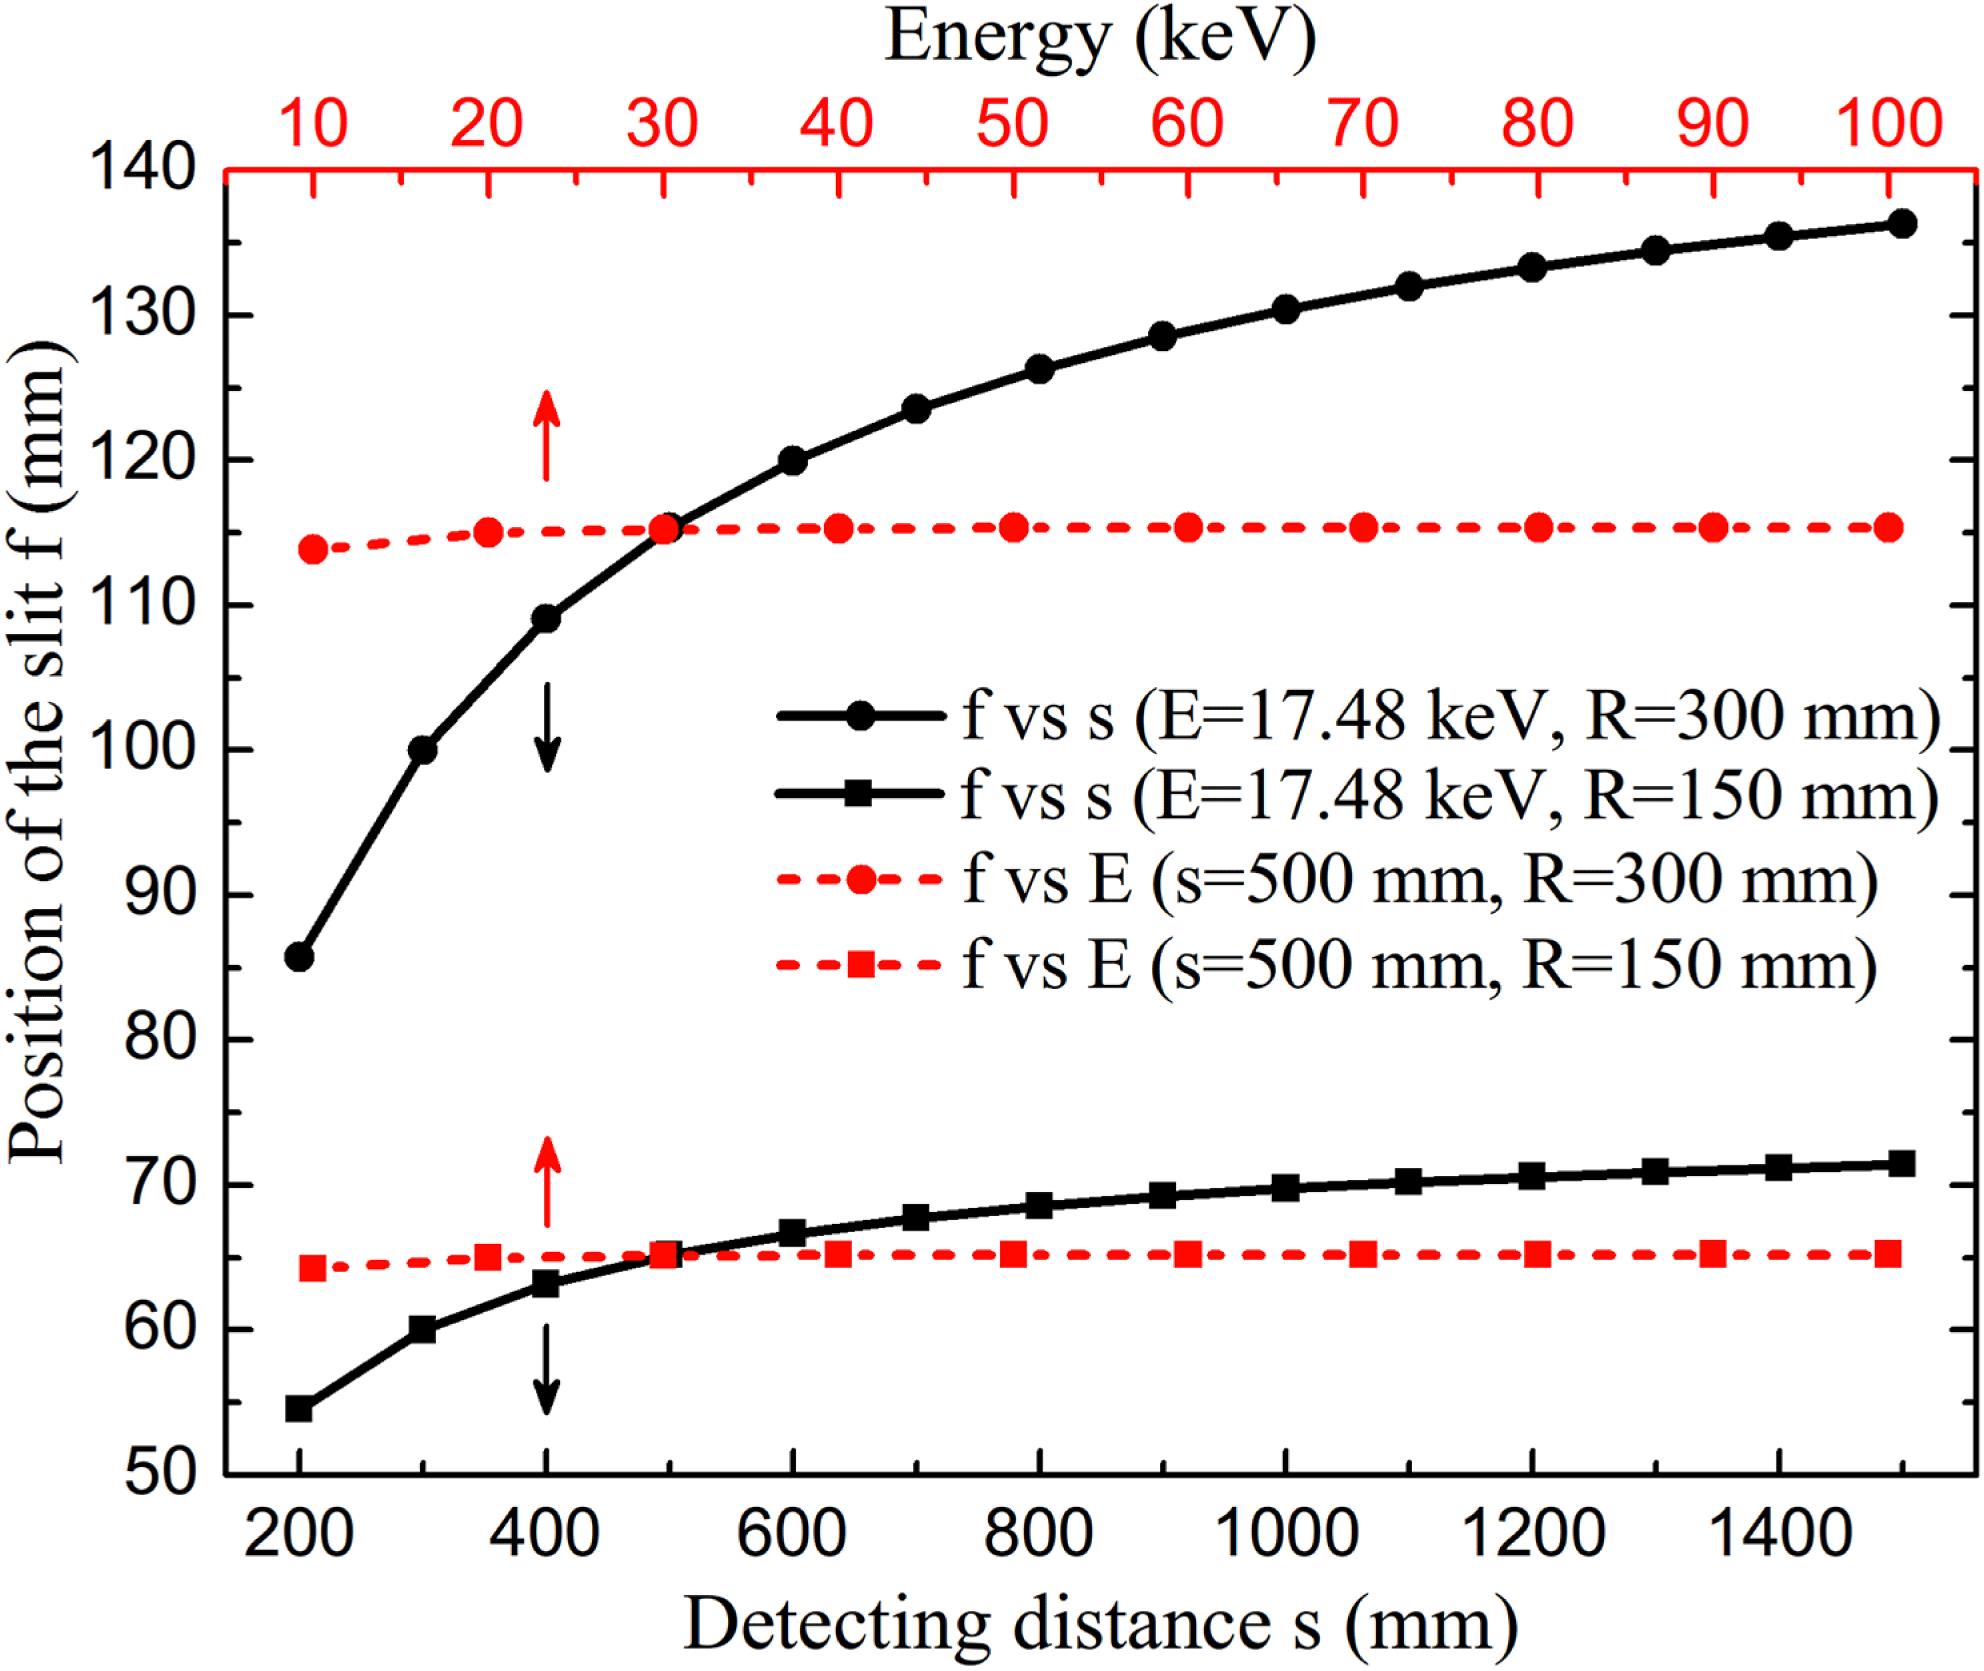
    Fig. 2. (Solid lines) the position of the slit $f$ versus the detecting distance $s$ (the source-to-crystal distance) of the 17.48 keV Mo K${\it\alpha}_{1}$ x-ray. (Dash lines) the position of the slit $f$ versus the x-ray photon energy at a fixed detecting distance, $s$, of 500 mm. The crystals’ curvature radii are 150 and 300 mm.
    The lateral distance of the 10 keV x-ray footprint on the crystal (Point C in Figure 1) versus the crystal’s curvature radius. The detecting distances $s$ are 200 mm (dash line) and 1500 mm (solid line).
    Fig. 3. The lateral distance of the 10 keV x-ray footprint on the crystal (Point C in Figure 1) versus the crystal’s curvature radius. The detecting distances $s$ are 200 mm (dash line) and 1500 mm (solid line).
    Theoretical spectral sensitivities of the transmission curved crystal spectrometers LCCS and HCCS. Insert is the sensitivity curve of Fujifilm™ image plates SR.
    Fig. 4. Theoretical spectral sensitivities of the transmission curved crystal spectrometers LCCS and HCCS. Insert is the sensitivity curve of Fujifilm™ image plates SR.
    Spectral resolution of the LCCS and HCCS spectrometers at detecting distances of 200 and 1500 mm. The working distance of the recording medium is fixed at $d_{0}=22~\text{mm}$.
    Fig. 5. Spectral resolution of the LCCS and HCCS spectrometers at detecting distances of 200 and 1500 mm. The working distance of the recording medium is fixed at $d_{0}=22~\text{mm}$.
    The energy-dependent integrated reflectivity of the curved crystals. The ${\it\alpha}$-quartz (10–11) crystals’ curvature radii are 300 mm (HCCS) and 150 mm (LCCS).
    Fig. 6. The energy-dependent integrated reflectivity of the curved crystals. The ${\it\alpha}$-quartz (10–11) crystals’ curvature radii are 300 mm (HCCS) and 150 mm (LCCS).
    Schematic diagram of the HCCS spectrometer.
    Fig. 7. Schematic diagram of the HCCS spectrometer.
    Experimental spectral images of a Mo anode x-ray source measured by (a) LCCS and (b) HCCS. Details of K lines are shown in (c) and (d), for LCCS and HCCS, respectively. The exposure times are 60 s for LCCS and 30 s for HCCS.
    Fig. 8. Experimental spectral images of a Mo anode x-ray source measured by (a) LCCS and (b) HCCS. Details of K lines are shown in (c) and (d), for LCCS and HCCS, respectively. The exposure times are 60 s for LCCS and 30 s for HCCS.
    Spectral images of the Mo anode x-ray source obtained by LCCS with various working distances $d_{\text{0}}$. (a) $d_{\text{0}}=7~\text{mm}$; (b) $d_{\text{0}}=22~\text{mm}$; (c) $d_{\text{0}}=52~\text{mm}$. The abscissa represents the distance from the left side of image.
    Fig. 9. Spectral images of the Mo anode x-ray source obtained by LCCS with various working distances $d_{\text{0}}$. (a) $d_{\text{0}}=7~\text{mm}$; (b) $d_{\text{0}}=22~\text{mm}$; (c) $d_{\text{0}}=52~\text{mm}$. The abscissa represents the distance from the left side of image.
    Experimentally measured and theoretically calculated spectral resolution at various working distances.
    Fig. 10. Experimentally measured and theoretically calculated spectral resolution at various working distances.
    Ag spectral images recorded using the HCCS at the XGIII laser facility (a), the detail characteristic K lines of Ag (b, c).
    Fig. 11. Ag spectral images recorded using the HCCS at the XGIII laser facility (a), the detail characteristic K lines of Ag (b, c).
    LCCS HCCS
    Crystal${\it\alpha}$-quartz (10–11) 70 mm ($L$) $\times$ 12 mm ($W$) $\times$ 0.27 mm ($T$)
    Curvature radius (mm) 150 300
    Energy range (keV) 10–56 17–100
    Detecting distance (mm)200–1500 200–1500
    Resolution $(E/{\rm\Delta}E)$331-57327-54
    Recording mediumFujifilm BAS-SR IPs 74 mm ($L$) $\times$ 20 mm ($W$)
    Table 1. Design parameters of the Curved Crystal Spectrometers (CCS).
    Ming-hai Yu, Guang-yue Hu, Ning An, Feng Qian, Yu-chi Wu, Xiao-ding Zhang, Yu-qiu Gu, Qiu-ping Wang, Jian Zheng. Hard x-ray transmission curved crystal spectrometers (10–100 keV) for laser fusion experiments at the ShenGuang-III laser facility[J]. High Power Laser Science and Engineering, 2016, 4(1): 010000e2
    Download Citation