
Augustinas Petrulėnas, Paulius Mackonis, Aleksej M. Rodin. High-efficiency bismuth borate-based optical parametric chirped pulse amplifier with approximately 2.1 mJ, 38 fs output pulses at approximately 2150 nm[J]. High Power Laser Science and Engineering, 2023, 11(2): 02000e27
- High Power Laser Science and Engineering
- Vol. 11, Issue 2, 02000e27 (2023)
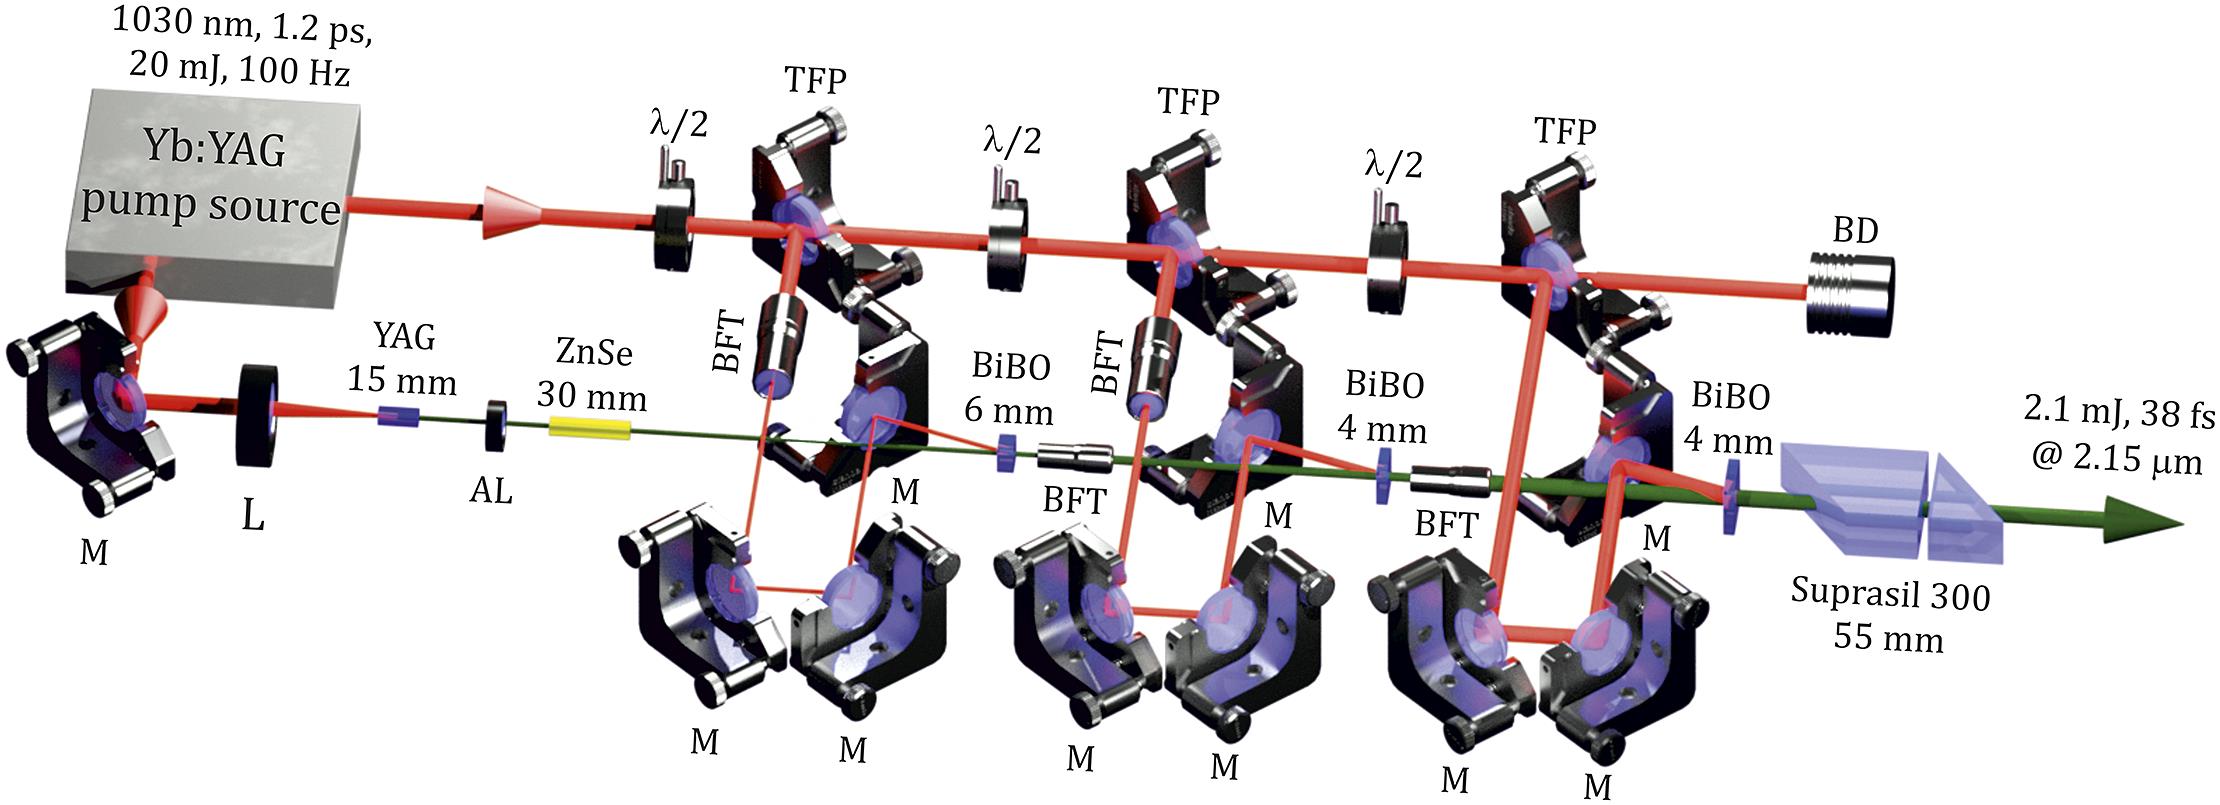
Fig. 1. Experimental setup of the mJ-level OPCPA operating in the SWIR range. Yb:YAG, a two-stage CPA providing approximately 1.2 ps pulses at 1030 nm for OPCPA pumping and generating the SC seed in the YAG crystal; TFP, thin-film polarizer; λ/2, half-wave retardation plate; L, focusing lens; AL, achromatic lens; ZnSe, AR-coated ZnSe plate; M, HR1030 nm mirror; BFT, beam forming telescope; BiBO, nonlinear parametric crystal; Suprasil 300, a pair of glass prisms for pulse compression.
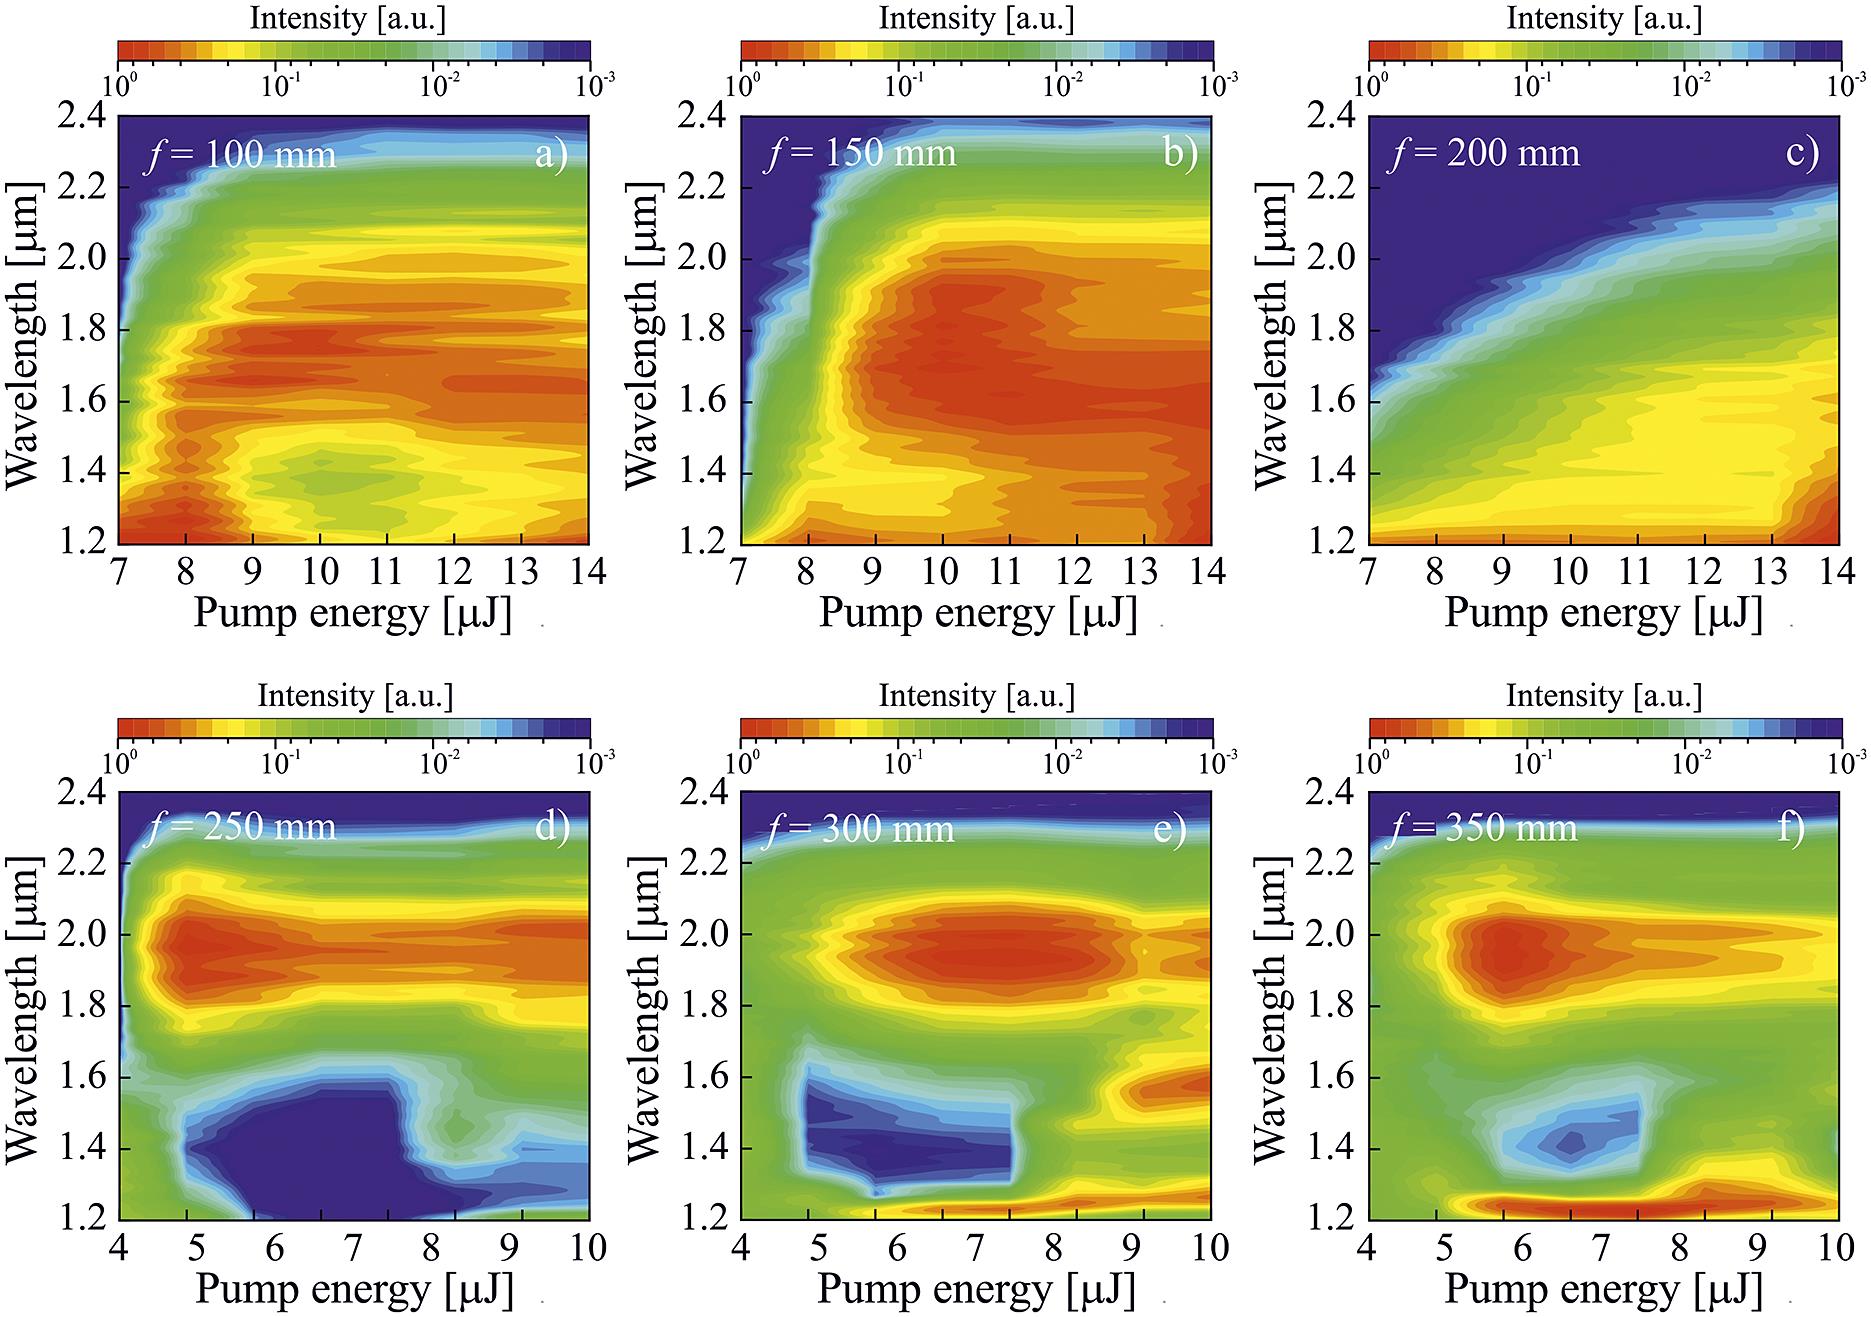
Fig. 2. Dependence of the intensity of the SC spectrum envelope on the pump pulse energy at different focal lengths for YAG crystals 15 mm (a)–(c) and 130 mm (d)–(f).
Fig. 3. Ratio of the energy stability of the SC and the pump pulse σSC/σPump as a function of the pump energy for different focusing into YAG crystals: (a) 15 mm and (b) 130 mm.
Fig. 4. SWIR wing of SC spectra under optimal excitation conditions in YAG crystals: (a) 15 mm and (b) 130 mm long. The insets show the corresponding beam profiles.
Fig. 5. Single-stage OPCPA configurations with (a) short and (b) long YAG crystals for SC generation.
Fig. 6. (a) Output spectrum of the first OPCPA stage with SC seed from a 130 mm long YAG crystal. Inset, transform-limited temporal shape, calculated from the measured spectra. (b) Pump-to-signal conversion efficiency in the first OPCPA stage with SC seed from a YAG crystal 130 mm long (solid line) and 15 mm long (dotted line), as well as with an additional chirp in a 30 mm ZnSe plate (dashed line).
Fig. 7. SHG-FROG retrieved temporal profile (solid line) and temporal phase (dashed line) of an amplified signal pulse after compression in Suprasil 300 with SC seed from a 15 mm YAG crystal compared to a transform-limited pulse calculated from the measured spectrum (dotted line). τ TL, transform-limited pulse width. Insets, measured (top) and reconstructed (bottom) FROG traces with an error of 0.9% using a grid of 512 × 512 points.
Fig. 8. (a) Output spectrum of a high-energy OPCPA. Inset, transform-limited temporal pulse shape calculated from the measured spectra. (b) Output energy versus the pump pulse energy in the final OPCPA stage. Inset, normalized beam profile in the far field at 2.15 μm at maximum output energy.
Fig. 9. (a) Amplified output energy stability of the OPCPA system for 30 min of operation. (b) SHG-FROG retrieved temporal profile (solid line) and temporal phase (dashed line) of the compressed signal pulse at maximum output energy compared to the transform-limited pulse calculated from the measured spectrum (dotted line). τ TL, transform-limited pulse width. Insets, measured (top) and reconstructed (bottom) FROG traces with an error of 1.1% using a grid of 512 × 512 points.
|
Table 1. Optimal focusing conditions for stable SC generation in the SWIR spectral range.

Set citation alerts for the article
Please enter your email address
© Copyright 2018-2021 | Chinese Laser Press. All Rights Reserved 沪ICP备15018463号-20