• Journal of Geo-information Science
  • Vol. 22, Issue 1, 88 (2020)
Hongchao FAN1、1、*, Wanzhi LI2、2, and Chaoquan ZHANG1、1、2、2
Author Affiliations
  • 1Norwegian University of Science and Technology, Trondheim 7491, Norway
  • 1挪威科技大学,特隆赫姆7491
  • 2Wuhan University, Wuhan 430072, China
  • 2武汉大学,武汉430072
  • show less
    DOI: 10.12082/dqxxkx.2020.190424 Cite this Article
    Hongchao FAN, Wanzhi LI, Chaoquan ZHANG. Anchor-Free Traffic Sign Detection[J]. Journal of Geo-information Science, 2020, 22(1): 88 Copy Citation Text show less
    AF-TSD network structure
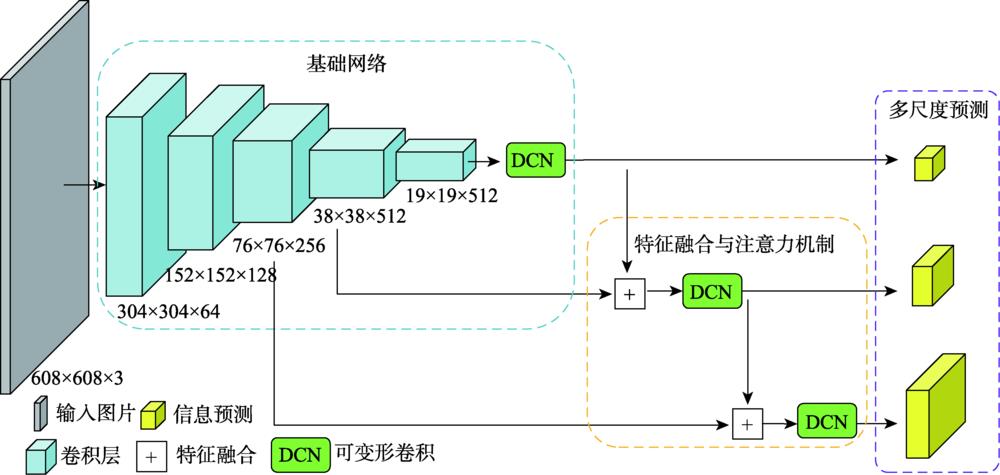
    Fig. 1. AF-TSD network structure
    Pre-processing of the input image
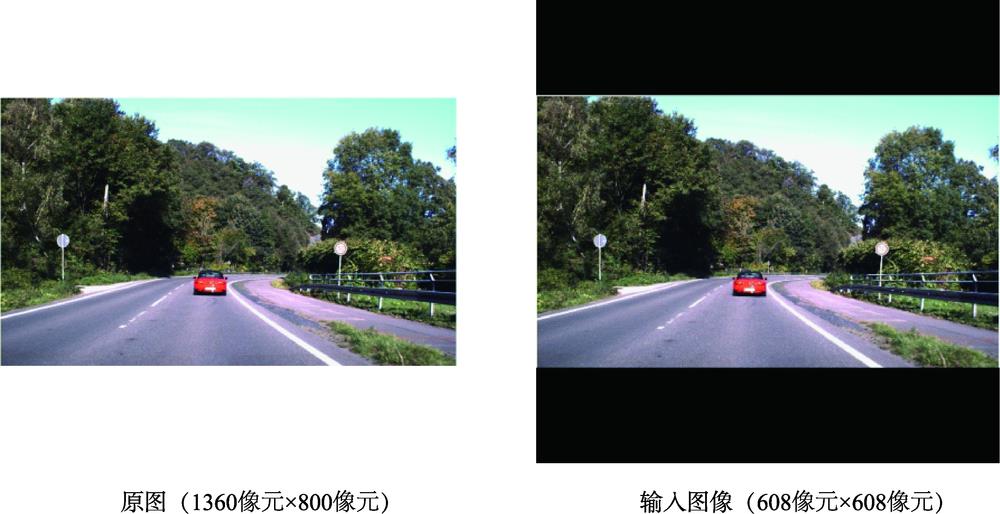
    Fig. 2. Pre-processing of the input image
    Pipeline of deformable convolution
    Fig. 3. Pipeline of deformable convolution
    Traditional convolution and deformable convolution
    Fig. 4. Traditional convolution and deformable convolution
    Pipeline of the attention mechanism
    Fig. 5. Pipeline of the attention mechanism
    GTSDB dataset
    Fig. 6. GTSDB dataset
    Curve of precision relative to recall rate in traffic sign detection
    Fig. 7. Curve of precision relative to recall rate in traffic sign detection
    Curve of training loss and test loss in AF-TSD network (the first 150 iterations)
    Fig. 8. Curve of training loss and test loss in AF-TSD network (the first 150 iterations)
    Traffic signs detection results
    Fig. 9. Traffic signs detection results
    方法输入图像尺寸像元×像元mAP/%s/每张图
    Faster R-CNN608×60888.500.120
    RetinaNet608×60892.430.094
    YOLOv3608×60893.540.024
    YOLOv3(Anchor-free)608×60894.920.026
    AF-TSD608×60896.800.032
    Table 2. Performance comparison of AF-TSD with Faster R-CNN, RetinaNet, YOLOv3, and YOLOve (Anchor-free)
    Hongchao FAN, Wanzhi LI, Chaoquan ZHANG. Anchor-Free Traffic Sign Detection[J]. Journal of Geo-information Science, 2020, 22(1): 88
    Download Citation