• Acta Physica Sinica
  • Vol. 69, Issue 2, 024302-1 (2020)
Dong-Liang Pei1、2, Tao Yang1、2, Meng Chen1、2、*, Yu Liu1、2, Wen-Shuai Xu1、2, Man-Gong Zhang3, Heng Jiang1、2、*, and Yu-Ren Wang1、2
Author Affiliations
  • 1Key Laboratory of Microgravity, Institute of Mechanics, Chinese Academy of Sciences, Beijing 100190, China
  • 2University of Chinese Academy of Sciences, Beijing 100049, China
  • 3Wuhan Second Ship Design and Research Institute, Hubei 430064, China
  • show less
    DOI: 10.7498/aps.69.20191454 Cite this Article
    Dong-Liang Pei, Tao Yang, Meng Chen, Yu Liu, Wen-Shuai Xu, Man-Gong Zhang, Heng Jiang, Yu-Ren Wang. Broadband periodic and aperiodic acoustic topological insulator based on composite honeycomb structure[J]. Acta Physica Sinica, 2020, 69(2): 024302-1 Copy Citation Text show less
    (a) The hexagon represents the cell of the lattice, where a1, a2 is the lattice basis vector, the blue “petal” shape at the apex of the hexagon and the circular structure at the center represent the hard scatterers surrounded by air; (b) the irreducible Brillouin zone Γ-M-K; (c) schematic diagram of crystal structure.(a)正六边形表示晶格的元胞, 其中a1, a2是晶格基矢. 在六边形顶点的蓝色“花瓣”形结构与位于中心的圆形结构表示位于空气中的硬质散射体; (b)晶格的最简布里渊区Γ-M-K; (c)晶格结构的示意图
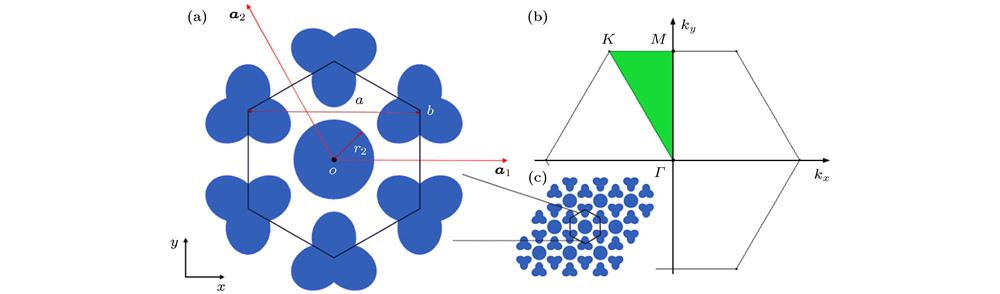
    Fig. 1. (a) The hexagon represents the cell of the lattice, where a1, a2 is the lattice basis vector, the blue “petal” shape at the apex of the hexagon and the circular structure at the center represent the hard scatterers surrounded by air; (b) the irreducible Brillouin zone Γ-M-K; (c) schematic diagram of crystal structure. (a)正六边形表示晶格的元胞, 其中a1, a2是晶格基矢. 在六边形顶点的蓝色“花瓣”形结构与位于中心的圆形结构表示位于空气中的硬质散射体; (b)晶格的最简布里渊区Γ-M-K; (c)晶格结构的示意图
    The band structures with different θ and its topological phase transition of the CHL: (a) θ = 0°, in which the lower two illustrations show the sound pressure field distribution of the d state, and the upper two illustrations show the sound pressure field distribution of the p state; (b) θ = 60°, in which the upper and lower illustrations show the sound pressure field distribution of the d and p states, respectively; (c) the topological phase diagram of the structure, indicating that the frequency band is reversed as the rotation angle changes; (d) the relative bandwidth of the band gap at different θ.CHL不同转角时的频带图与其拓扑相变 (a) θ = 0°, 其中下面两幅插图表示d态的声压场分布, 上面两幅插图表示p态的声压场分布; (b) θ = 60°, 插图表示p, d态的声压场分布; (c)结构的拓扑相图, 表示随着转角变化, 频带发生反转; (d)不同转角下带隙的相对带宽
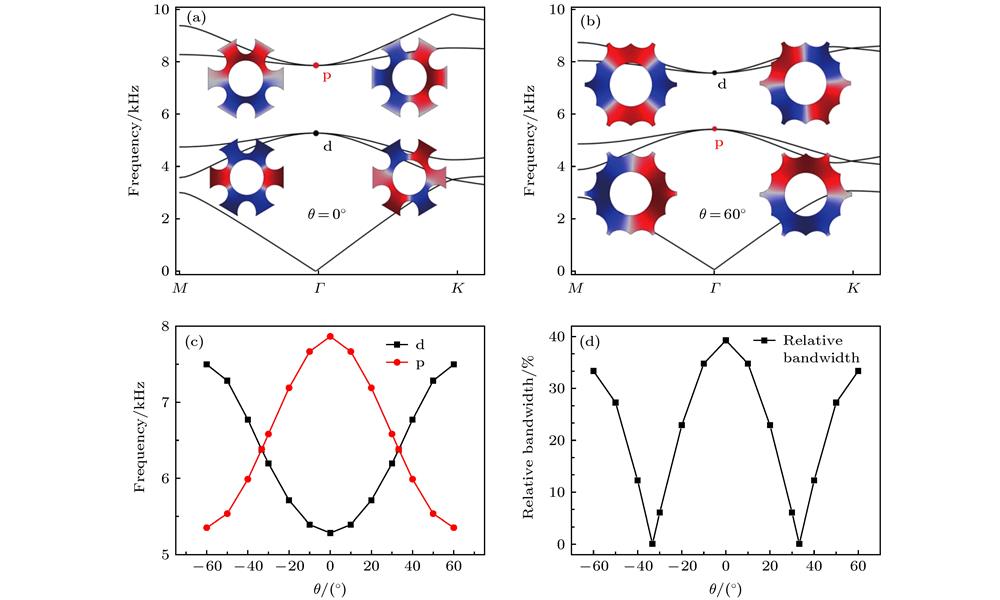
    Fig. 2. The band structures with different θ and its topological phase transition of the CHL: (a) θ = 0°, in which the lower two illustrations show the sound pressure field distribution of the d state, and the upper two illustrations show the sound pressure field distribution of the p state; (b) θ = 60°, in which the upper and lower illustrations show the sound pressure field distribution of the d and p states, respectively; (c) the topological phase diagram of the structure, indicating that the frequency band is reversed as the rotation angle changes; (d) the relative bandwidth of the band gap at different θ. CHL不同转角时的频带图与其拓扑相变 (a) θ = 0°, 其中下面两幅插图表示d态的声压场分布, 上面两幅插图表示p态的声压场分布; (b) θ = 60°, 插图表示p, d态的声压场分布; (c)结构的拓扑相图, 表示随着转角变化, 频带发生反转; (d)不同转角下带隙的相对带宽
    (a) The projection band structure of the type I edge along the kx direction. The gray area in the figure represents the bulk state, and the red dotted line represents the edge state. The illustrations on both sides indicate that the five-layer trivial phononic crystal with θ = 60° and the five-layer nontrivial phononic crystal with θ = 0° are spliced along the ky direction to form the supercell and the sound pressure distribution at a1, a2,b1, b2; (b) the projection band structure of the type II edge along the ky direction. The illustrations on both sides indicate that a 10-layer trivial phononic crystal with θ = 60° and a 10-layer nontrivial phononic crystal with θ = 0° are spliced together in the kx direction to form the supercell and the sound pressure distribution at points c1,c2, d1, d2. The black curved arrow in the illustration indicates the energy flow direction at the edge.(a) Ⅰ型边界沿kx方向的投影带结构, 图中的灰色区域表示体态, 红色点线表示边界态, 两侧插图表示θ = 60°的5层平庸型声子晶体与θ = 0°的5层非平庸型声子晶体沿着ky方向拼接起来, 构成的超胞及a1, a2, b1, b2点的声压分布; (b) Ⅱ型边界沿ky方向的投影带结构, 两侧插图表示θ = 60°的10层平庸型声子晶体与θ = 0°的10层非平庸型声子晶体沿着kx方向拼接起来, 构成的超胞及c1, c2, d1, d2点的声压分布, 插图中的黑色弧形箭头表示边界处的能流方向
    Fig. 3. (a) The projection band structure of the type I edge along the kx direction. The gray area in the figure represents the bulk state, and the red dotted line represents the edge state. The illustrations on both sides indicate that the five-layer trivial phononic crystal with θ = 60° and the five-layer nontrivial phononic crystal with θ = 0° are spliced along the ky direction to form the supercell and the sound pressure distribution at a1, a2,b1, b2; (b) the projection band structure of the type II edge along the ky direction. The illustrations on both sides indicate that a 10-layer trivial phononic crystal with θ = 60° and a 10-layer nontrivial phononic crystal with θ = 0° are spliced together in the kx direction to form the supercell and the sound pressure distribution at points c1,c2, d1, d2. The black curved arrow in the illustration indicates the energy flow direction at the edge. (a) Ⅰ型边界沿kx方向的投影带结构, 图中的灰色区域表示体态, 红色点线表示边界态, 两侧插图表示θ = 60°的5层平庸型声子晶体与θ = 0°的5层非平庸型声子晶体沿着ky方向拼接起来, 构成的超胞及a1, a2, b1, b2点的声压分布; (b) Ⅱ型边界沿ky方向的投影带结构, 两侧插图表示θ = 60°的10层平庸型声子晶体与θ = 0°的10层非平庸型声子晶体沿着kx方向拼接起来, 构成的超胞及c1, c2, d1, d2点的声压分布, 插图中的黑色弧形箭头表示边界处的能流方向
    The sound pressure distribution and transmission spectrum of the structure when a plane wave is incident from the left side with amplitude 1 Pa and f = 6900 Hz: (a) A mixed phononic crystal composed of a spliced structure of phononic crystals with θ = 60° and θ = 0°, and the edge between the two phononic crystals is called the topological edge. The cyan arrow on the left side indicates the plane wave incidence. It can be seen from the sound pressure distribution that the sound wave can propagate around the right angle and the Z-angle along the edge; (b) introduce disorder and cavity on the basis of Fig. (a), sound waves can still propagate around these defects; (c) a structure consisted of phononic crystals with θ = 60° alone where sound waves cannot propagate; (d) sound intensity transmission spectra of the structures of Fig. (a)—Fig. (c).幅值为1, f = 6900 Hz的平面波从左侧入时结构的声压分布及透射谱 (a)由θ = 60°与θ = 0°的声子晶体的拼接结构组成的混合声子晶体, 两种声子晶体的相接触的边界称为拓扑边界, 左侧的青色箭头表示平面波入射, 从图中声压分布可以看出: 声波能够绕过直角与Z形角沿着边界进行传播; (b)在图(a)的基础上继续引入乱序与缺失的缺陷, 声波依然能够绕过这些缺陷传播; (c)由θ = 60°声子晶体单独构成的结构, 声波不能传播; (d)图(a)—图(c)结构的声强透射谱
    Fig. 4. The sound pressure distribution and transmission spectrum of the structure when a plane wave is incident from the left side with amplitude 1 Pa and f = 6900 Hz: (a) A mixed phononic crystal composed of a spliced structure of phononic crystals with θ = 60° and θ = 0°, and the edge between the two phononic crystals is called the topological edge. The cyan arrow on the left side indicates the plane wave incidence. It can be seen from the sound pressure distribution that the sound wave can propagate around the right angle and the Z-angle along the edge; (b) introduce disorder and cavity on the basis of Fig. (a), sound waves can still propagate around these defects; (c) a structure consisted of phononic crystals with θ = 60° alone where sound waves cannot propagate; (d) sound intensity transmission spectra of the structures of Fig. (a)—Fig. (c). 幅值为1, f = 6900 Hz的平面波从左侧入时结构的声压分布及透射谱 (a)由θ = 60°与θ = 0°的声子晶体的拼接结构组成的混合声子晶体, 两种声子晶体的相接触的边界称为拓扑边界, 左侧的青色箭头表示平面波入射, 从图中声压分布可以看出: 声波能够绕过直角与Z形角沿着边界进行传播; (b)在图(a)的基础上继续引入乱序与缺失的缺陷, 声波依然能够绕过这些缺陷传播; (c)由θ = 60°声子晶体单独构成的结构, 声波不能传播; (d)图(a)—图(c)结构的声强透射谱
    (a) The frequency corresponding to the d and p states with the changes of the parameter s at Γ; (b) the topological phase diagram of the structure at s = 0.8; (c) the topological phase diagram of the structure at s = 1.2.(a) Γ处d, p态对应的频率值随s的变化情况; (b) s = 0.8时结构的拓扑相图; (c) s = 1.2时结构的拓扑相图
    Fig. 5. (a) The frequency corresponding to the d and p states with the changes of the parameter s at Γ; (b) the topological phase diagram of the structure at s = 0.8; (c) the topological phase diagram of the structure at s = 1.2. (a) Γ处d, p态对应的频率值随s的变化情况; (b) s = 0.8时结构的拓扑相图; (c) s = 1.2时结构的拓扑相图
    Sound pressure distribution of aperiodic topological insulator structure: (a) A periodic acoustic topological insulator composed of three phononic crystal structures with s = 0.8, 1.0, and 1.2 and its sound pressure amplitude distribution when sound wave with f = 6900 Hz is incident from the right side. The horizontal dashed line in the middle indicates the horizontal stitching position, and the vertical dashed line indicates the vertical stitching position. The first and second insets represent the lattice cells with θ = 0° and s of 0.8 and 1.0, respectively. The specific positions of the three phononic crystals are shown in the third illustration, where A, B, and C respectively represent s = 0.8, 1.0, and 1.2, and the numbers 1 and 2 represent θ = 0° and 60°, respectively. The cyan arrow on the right indicates the incident plane wave; (b) the sound pressure amplitude distribution along the y direction at x = 20a, and its value is normalized by the maximum value; (c) the distribution of the sound pressure amplitude when introducing disorder and cavity on the basis of Fig. (a).非周期拓扑绝缘体结构的声压分布 (a)为由s为0.8, 1.0, 1.2三种声子晶体构造的非周期声拓扑绝缘体组成及其在右侧f = 6900 Hz声波入射下的声压幅值分布. 中间的横虚线表示水平拼接位置, 竖虚线表示竖直拼接位置, 第一、二幅插图代表θ为0°, s为0.8, 1.0时, 晶格的元胞. 三种声子晶体的具体位置如第三幅插图所示, 其中A, B, C分别表示s为0.8, 1.0, 1.2三种结构, 数字1, 2分别代表θ为0°, 60°两种不同的转角, 右侧的青色箭头代表平面波入射; (b)表示x = 20a处沿着y方向的声压幅值分布, 其值经过最大值归一化; (c)在图(a)的基础上进一步引入乱序与缺失的缺陷时结构声压幅值的分布
    Fig. 6. Sound pressure distribution of aperiodic topological insulator structure: (a) A periodic acoustic topological insulator composed of three phononic crystal structures with s = 0.8, 1.0, and 1.2 and its sound pressure amplitude distribution when sound wave with f = 6900 Hz is incident from the right side. The horizontal dashed line in the middle indicates the horizontal stitching position, and the vertical dashed line indicates the vertical stitching position. The first and second insets represent the lattice cells with θ = 0° and s of 0.8 and 1.0, respectively. The specific positions of the three phononic crystals are shown in the third illustration, where A, B, and C respectively represent s = 0.8, 1.0, and 1.2, and the numbers 1 and 2 represent θ = 0° and 60°, respectively. The cyan arrow on the right indicates the incident plane wave; (b) the sound pressure amplitude distribution along the y direction at x = 20a, and its value is normalized by the maximum value; (c) the distribution of the sound pressure amplitude when introducing disorder and cavity on the basis of Fig. (a). 非周期拓扑绝缘体结构的声压分布 (a)为由s为0.8, 1.0, 1.2三种声子晶体构造的非周期声拓扑绝缘体组成及其在右侧f = 6900 Hz声波入射下的声压幅值分布. 中间的横虚线表示水平拼接位置, 竖虚线表示竖直拼接位置, 第一、二幅插图代表θ为0°, s为0.8, 1.0时, 晶格的元胞. 三种声子晶体的具体位置如第三幅插图所示, 其中A, B, C分别表示s为0.8, 1.0, 1.2三种结构, 数字1, 2分别代表θ为0°, 60°两种不同的转角, 右侧的青色箭头代表平面波入射; (b)表示x = 20a处沿着y方向的声压幅值分布, 其值经过最大值归一化; (c)在图(a)的基础上进一步引入乱序与缺失的缺陷时结构声压幅值的分布
    Dong-Liang Pei, Tao Yang, Meng Chen, Yu Liu, Wen-Shuai Xu, Man-Gong Zhang, Heng Jiang, Yu-Ren Wang. Broadband periodic and aperiodic acoustic topological insulator based on composite honeycomb structure[J]. Acta Physica Sinica, 2020, 69(2): 024302-1
    Download Citation