• Journal of Atmospheric and Environmental Optics
  • Vol. 18, Issue 4, 383 (2023)
GUO Tingwei1,2, HUANG Honglian1,*, SUN Xiaobing1, LIU Xiao1, and TI Rufang1
Author Affiliations
  • 1Key Laboratory of Optical Calibration and Characterization, Anhui Institute of Optics and Fine Mechanics, HFIPS,Chinese Academy of Sciences, Hefei 230031, China
  • 2University of Science and Technology of China, Hefei 230026, China
  • show less
    DOI: 10.3969/j.issn.1673-6141.2023.04.010 Cite this Article
    Tingwei GUO, Honglian HUANG, Xiaobing SUN, Xiao LIU, Rufang TI. Detection and removal of thin clouds in multispectral images of HJ-2A/B satellites[J]. Journal of Atmospheric and Environmental Optics, 2023, 18(4): 383 Copy Citation Text show less
    HTM formed by extrapolating from the blue band with different window sizes. (a) Original image; (b) ω = 3; (c) ω = 5; (d) ω = 7
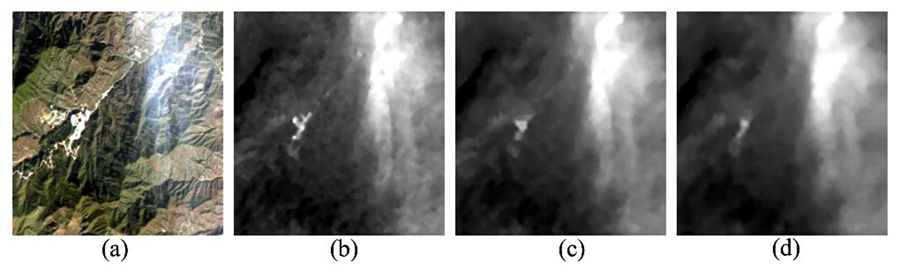
    Fig. 1. HTM formed by extrapolating from the blue band with different window sizes. (a) Original image; (b)  ω = 3; (c)  ω = 5; (d)  ω = 7
    Judgment results of different window sizes for thin cloud masks. (a) Original image; (b) ω = 11; (c) ω = 21; (d) ω = 31
    Fig. 2. Judgment results of different window sizes for thin cloud masks. (a) Original image; (b)  ω = 11; (c)  ω = 21; (d)  ω = 31
    Effect of different window sizes on the final image for each band. (a) Original image; (b) ω = 3; (c) ω = 11; (d) ω = 21
    Fig. 3. Effect of different window sizes on the final image for each band. (a) Original image; (b)  ω = 3; (c)  ω = 11; (d)  ω = 21
    Normalized spectral response curves of each spectrum segment for each CCD camera. (a) CCD 1; (b) CCD 2; (c) CCD 3; (d) CCD 4
    Fig. 4. Normalized spectral response curves of each spectrum segment for each CCD camera. (a) CCD 1; (b) CCD 2; (c) CCD 3; (d) CCD 4
    Technical route for thin cloud removal in multispectral remote sensing images
    Fig. 5. Technical route for thin cloud removal in multispectral remote sensing images
    Highlighted object area in area A. (a) Original image; (b) highlighted area
    Fig. 6. Highlighted object area in area A. (a) Original image; (b) highlighted area
    Area A and its HTM image. (a) Original image; (b) HTM image
    Fig. 7. Area A and its HTM image. (a) Original image; (b) HTM image
    Cloud mask image of area A. (a) Original image; (b) cloud mask image
    Fig. 8. Cloud mask image of area A. (a) Original image; (b) cloud mask image
    HTMi calculation results of each band in area A. (a) Band 1; (b) band 2; (c) band 3; (d) band 4; (e) band 5
    Fig. 9. HTMi calculation results of each band in area A. (a) Band 1; (b) band 2; (c) band 3; (d) band 4; (e) band 5
    Linear regression coefficient of each band in area A. (a) Band 1; (b) band 2; (c) band 3; (d) band 4; (e) band 5
    Fig. 10. Linear regression coefficient of each band in area A. (a) Band 1; (b) band 2; (c) band 3; (d) band 4; (e) band 5
    The images for area A-D before and after thin cloud removal. (a) Original images; (b) images after removing thin clouds
    Fig. 11. The images for area A-D before and after thin cloud removal. (a) Original images; (b) images after removing thin clouds
    Comparison of clarity before and after thin cloud removal in area A-D. (a) Area A; (b) area B; (c) area C; (d) area D
    Fig. 12. Comparison of clarity before and after thin cloud removal in area A-D. (a) Area A; (b) area B; (c) area C; (d) area D
    Comparision of image contrast before and after thin cloud removal in area A-D. (a) Area A; (b) area B; (c) area C; (d) area D
    Fig. 13. Comparision of image contrast before and after thin cloud removal in area A-D. (a) Area A; (b) area B; (c) area C; (d) area D
    Comparison of image standard deviation before and after thin cloud removal in area A-D. (a) Area A; (b) area B; (c) area C; (d) area D
    Fig. 14. Comparison of image standard deviation before and after thin cloud removal in area A-D. (a) Area A; (b) area B; (c) area C; (d) area D
    Histogram area selection of cloud-free area before and after thin cloud removal in area A. (a) Original image; (b) after thin cloud removal
    Fig. 15. Histogram area selection of cloud-free area before and after thin cloud removal in area A. (a) Original image; (b) after thin cloud removal
    The histogram results of the cloud-free area for different bands before and after thin cloud removal in area A. (a) Original images; (b) after removing thin clouds
    Fig. 16. The histogram results of the cloud-free area for different bands before and after thin cloud removal in area A. (a) Original images; (b) after removing thin clouds
    Camera numberBand 1Band 2Band 3Band 4Band 5
    CCD 10.0507550.0417900.0361530.0415440.037851
    CCD 20.0507420.0413520.0363950.410740.038274
    CCD 30.0528590.0416820.0361560.0422670.03983
    CCD 40.0528590.0424260.0368710.0425120.038774
    Table 1. Radiance gain coefficients of different CCD cameras in different wavebands
    Tingwei GUO, Honglian HUANG, Xiaobing SUN, Xiao LIU, Rufang TI. Detection and removal of thin clouds in multispectral images of HJ-2A/B satellites[J]. Journal of Atmospheric and Environmental Optics, 2023, 18(4): 383
    Download Citation