• Acta Physica Sinica
  • Vol. 69, Issue 17, 174208-1 (2020)
Xiang-Cao Li, Bao-An Liu, Meng Li, Chun-Yan Yan, Jie Ren, Chang Liu, and Xin Ju*
Author Affiliations
  • School of Mathematics and Physics, University of Science and Technology Beijing, Beijing 100083, China
  • show less
    DOI: 10.7498/aps.69.20200482 Cite this Article
    Xiang-Cao Li, Bao-An Liu, Meng Li, Chun-Yan Yan, Jie Ren, Chang Liu, Xin Ju. Photoluminescence spectrum study of defects of potassium dihydrogen phosphate crystals irradiated by different laser fluences[J]. Acta Physica Sinica, 2020, 69(17): 174208-1 Copy Citation Text show less
    PL emission spectra of KDP crystal with different flux irradiations measured from (a) 200 to 400 nm and (b) 400 to 800 nm.
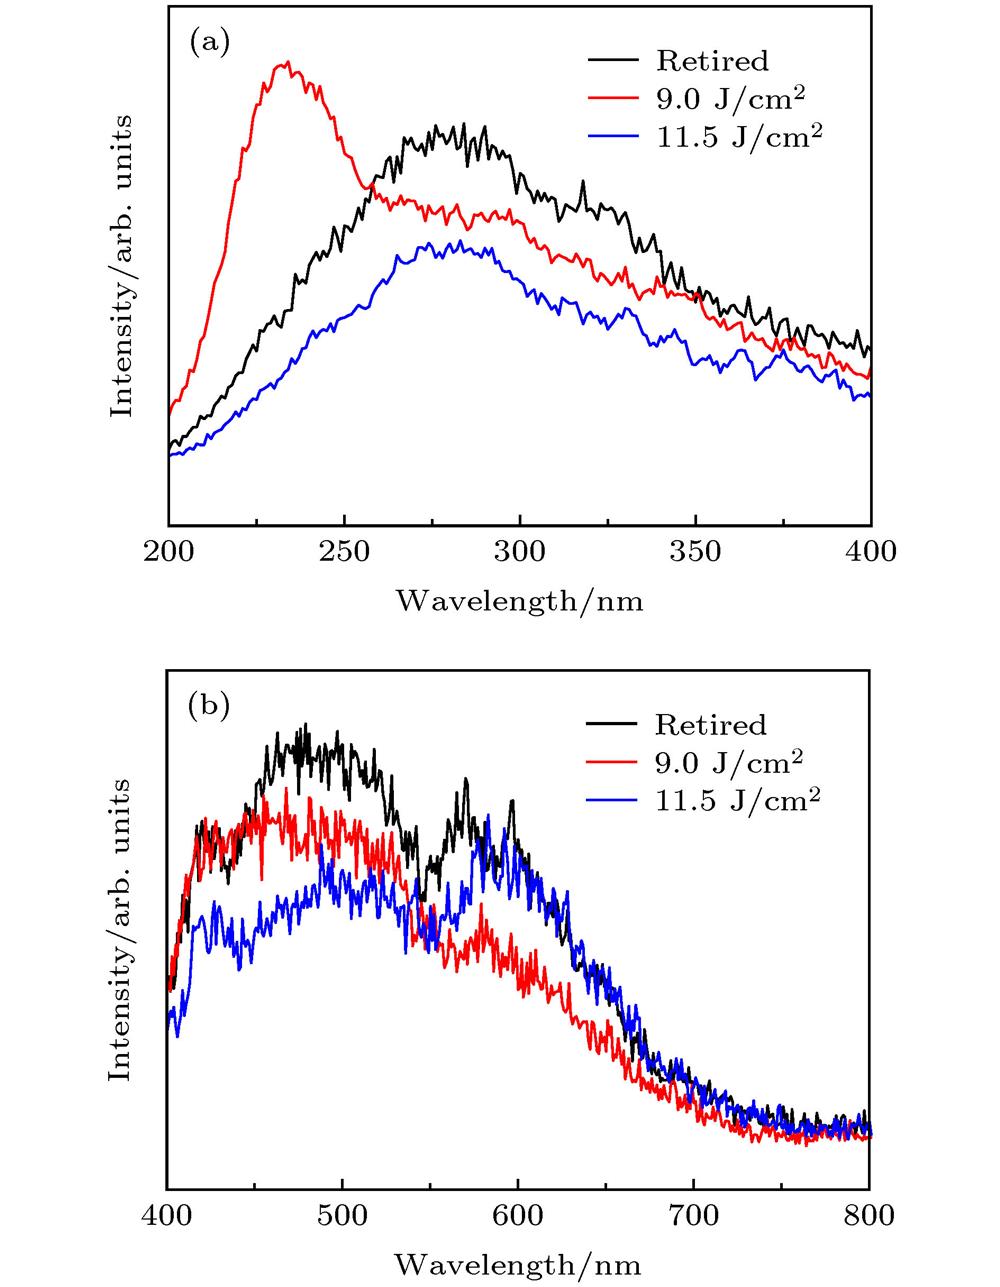
    Fig. 1. PL emission spectra of KDP crystal with different flux irradiations measured from (a) 200 to 400 nm and (b) 400 to 800 nm.
    PL emission spectra of KDP crystals with different flux irradiations measured from 400 to 800 nm: (a) Retired; (b) 9.0 J/cm2; (c) 11.5 J/cm2. The black solid lines represent the experiment spectra, the red dotted lines represent the simulated spectra, and the blue lines represent the Gaussian fitting curve.
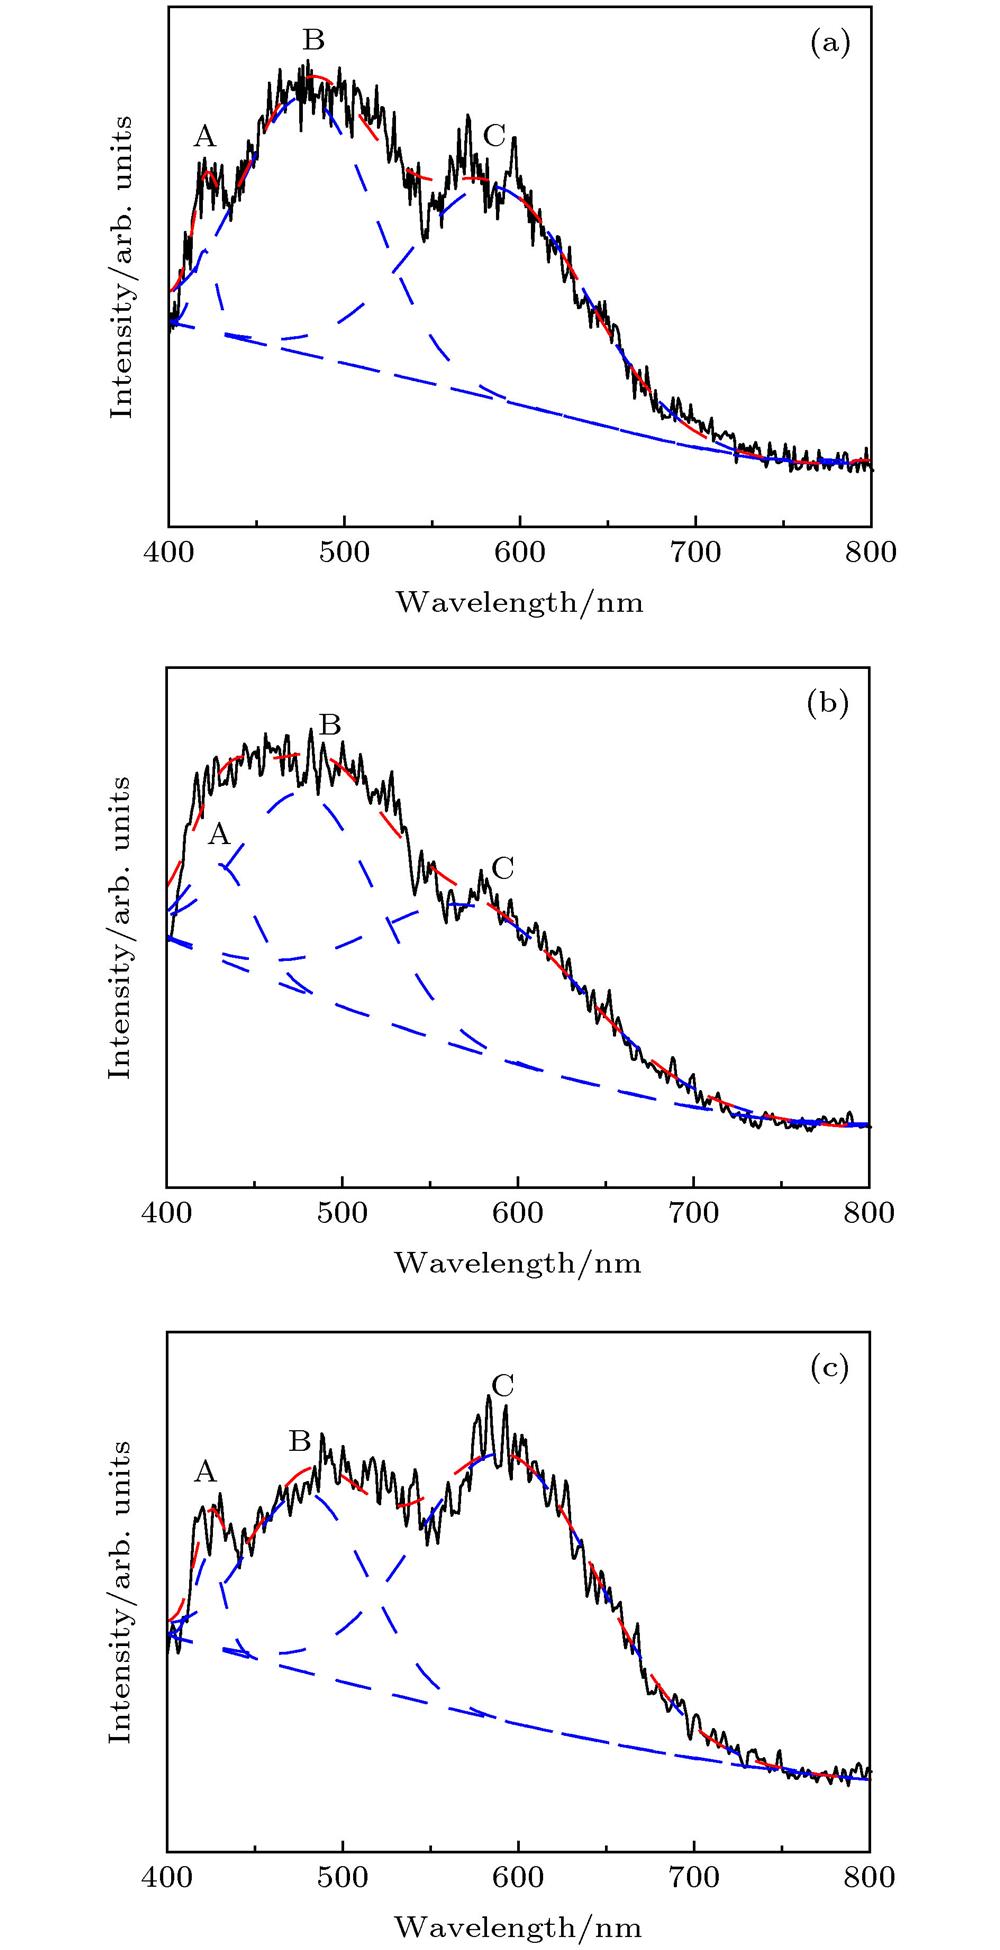
    Fig. 2. PL emission spectra of KDP crystals with different flux irradiations measured from 400 to 800 nm: (a) Retired; (b) 9.0 J/cm2; (c) 11.5 J/cm2. The black solid lines represent the experiment spectra, the red dotted lines represent the simulated spectra, and the blue lines represent the Gaussian fitting curve.
    PL emission spectra of KDP crystals with different flux irradiations were measured from 200 to 400 nm: (a) Retired; (b) 9.0 J/m2; (c) 11.5 J/m2. The black solid lines represent the experiment spectra, the red dotted lines represent the simulated spectra and blue lines represent the Gaussian fitting curve.
    Fig. 3. PL emission spectra of KDP crystals with different flux irradiations were measured from 200 to 400 nm: (a) Retired; (b) 9.0 J/m2; (c) 11.5 J/m2. The black solid lines represent the experiment spectra, the red dotted lines represent the simulated spectra and blue lines represent the Gaussian fitting curve.
    PeakPosition/nmArea/arb. units.FWHM/nm
    Retired9.0 J/cm211.5 J/cm2Retired9.0 J/cm211.5 J/cm2Retired9.0 J/cm211.5 J/cm2
    A420.27430.52423.870.120.350.1315.3845.1419.41
    B479.19480.94480.542.231.501.1288.9591.5380.68
    C587.24578.64593.582.401.682.51116.60140.89122.17
    Table 1. Parameters of peaks with Gaussian fitting for samples irradiated by different flux irradiations measured from 400 to 800 nm.
    PeakPosition/nmArea/arb. unitsFWHM/nm
    Retired9.0 J/cm211.5 J/cm2Retired9.0 J/cm211.5 J/cm2Retired9.0 J/cm211.5 J/cm2
    A231.552.0032.89
    B268.01269.61269.043.332.262.2971.6662.6167.12
    C324.02326.95326.822.671.941.3591.9083.3079.92
    Table 2. Parameters of peaks with Gaussian fitting for samples irradiated by different flux irradiations measured from 200 to 400 nm.
    Xiang-Cao Li, Bao-An Liu, Meng Li, Chun-Yan Yan, Jie Ren, Chang Liu, Xin Ju. Photoluminescence spectrum study of defects of potassium dihydrogen phosphate crystals irradiated by different laser fluences[J]. Acta Physica Sinica, 2020, 69(17): 174208-1
    Download Citation