
Beibei Zhu, Min Xue, Changyuan Yu, Shilong Pan. Broadband instantaneous multi-frequency measurement based on chirped pulse compression[J]. Chinese Optics Letters, 2021, 19(10): 101202
- Chinese Optics Letters
- Vol. 19, Issue 10, 101202 (2021)
Abstract
Keywords
1. Introduction
Instantaneous frequency measurement (IFM) is an essential function for emerging applications such as electronic warfare and cognitive radio systems[
Photonics-based IFM utilizing frequency-to-power mapping is a simple and widespread method[
In this Letter, an instantaneous multi-frequency measurement method featuring broad bandwidth and high accuracy is proposed and experimentally demonstrated. Chirped pulse compression is the key to measure the frequencies precisely, which converts zero points of the waveform envelope into sharp correlation peaks. Potentially, sub-megahertz (MHz) frequency accuracy and a hundreds-gigahertz (GHz) measurement range are achievable. In the experiments, both single- and multi-frequency measurements are performed. Frequency accuracy better than within a frequency measurement range of 3 to 18 GHz is achieved. Last but not least, the importance of the length of the time window in achieving highly accurate frequency measurements needs to be pointed out. Recently, many approaches to short time window measurements of radio frequencies have been proposed, such as a compressive sensing system that achieved 100 MHz resolution in a 5 ns time window and tens of kilohertz (kHz) resolution in a microsecond time window[
Sign up for Chinese Optics Letters TOC. Get the latest issue of Chinese Optics Letters delivered right to you!Sign up now
2. Principle
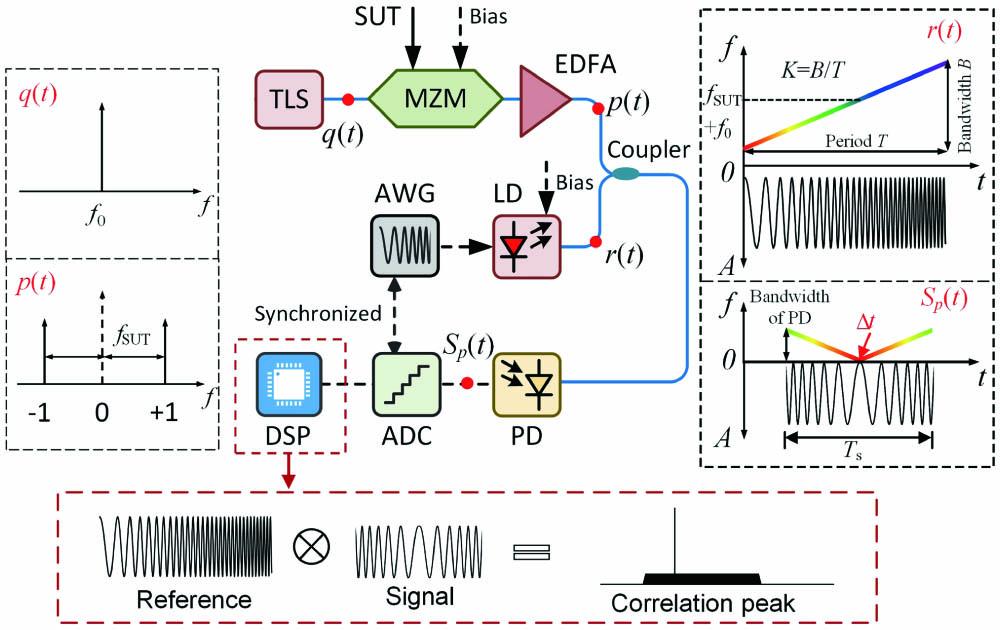
Figure 1 shows the schematic diagram of the proposed instantaneous multi-frequency measurement system. In the upper path, the SUT is modulated on an optical carrier from a tunable laser source (TLS) at a Mach–Zehnder modulator (MZM). By biasing the MZM at the minimum transmission point (MITP), a carrier-suppressed double-sideband (CS-DSB) signal is generated. Mathematically, the expression can be written as
![]()
Figure 1.Schematic diagram for the proposed instantaneous multi-frequency measurement system. TLS, tunable laser source; PC, polarization controller; SUT, signal-under-test; MZM, Mach–Zehnder modulator; EDFA, erbium-doped fiber amplifier; AWG, arbitrary waveform generator; LD, laser diode; DSP, digital signal processor; ADC, analog-to-digital converter; PD, photodetector.
In the lower path, a laser diode (LD) driven by a sawtooth waveform produces an optical linearly frequency-modulated (LFM) signal. Its time-domain expression is
After amplification, the CS-DSB signal is coupled with the optical LFM signal. By carefully setting and , the -order sideband of the CS-DSB signal is located in the frequency sweeping range of the optical LFM signal while the -1st-order sideband is out of the frequency sweeping range. By square-law detection of the combined signal at a PD and extracting the low-frequency components, the frequency of the SUT is converted into a time delay carried by a low-frequency chirped signal. To simplify the processing, we let . In this case, the electrical field of the generated chirped photocurrent can be expressed as
The low-frequency chirped photocurrent is sampled by an analog-to-digital converter (ADC). Then, the chirped pulse compression is performed by correlating the low-frequency chirped photocurrent with a reference LFM signal. The frequency of the reference LFM signal should cover zero to the largest possible frequency of the chirped signal, given by
Mathematically, the correlation function is
The correlation function is a Sinc function, which has the first zero points located at , where is the bandwidth of the LFM signal. Thus, the width of the compressed pulse is defined as , and the theoretical frequency resolution is . This mathematically establishes the relationship between the peak location and the delay induced by the SUT. Thus, by locating the sharp correlation peak, the time delay is obtained. Further, the frequency of the SUT is correspondingly calculated according to Eq. (4).
It is worth mentioning that, benefiting from the chirped pulse compression, the correlation peak becomes sharp, and the location accuracy is greatly improved, leading to great improvement of the frequency identify accuracy. Moreover, multi-frequency measurement is achievable, as the correlation peaks introduced by different frequencies are distinguishable.
3. Experiment
An experiment is carried out. A TLS (Anritsu MG9638A) emits a 1544.485 nm lightwave with an optical power of 8-dBm. An MZM with a 3-dB bandwidth of 20 GHz (JDS Uniphase, Model 10023874) is used to convert an SUT produced by a microwave signal generator (Agilent E8254A) into a CS-DSB signal. An optical LFM signal owning a pulse width of 20 µs (chirp rate is generated by an optical LFM generator comprised by an electrical arbitrary waveform generator (AWG, Agilent 33250A), a homemade trans-conductance amplifier (TCA), and a commercial LD (FU-641SEA-1). A 10-GHz PD (Nortel Inc.) followed by a 1.2-GHz low-pass filter is used to achieve optical-to-electrical conversion and low-frequency component extraction. Thus, the theoretical frequency resolution is . A real-time oscilloscope (Agilent DSO-X 93204A) is employed to record the generated photocurrent, which also functions as an ADC.
Figure 2 shows the single- and multi-frequency measurement results achieved by the proposed IFM method. When tuning the frequency of the SUT from 3 to 18 GHz with a frequency step of 1 GHz, the waveforms of the generated low-frequency photocurrents are shown in Fig. 2(a). As can be seen, the zero points of the waveform envelopes are observable, which have time delays depending on the frequencies of the SUT. For example, when a 7-GHz SUT is applied to the measurement system, the zero point can be easily recognized but difficult to precisely locate, as shown in Fig. 2(b). It is because the frequency together with the amplitude of the generated chirped photocurrent approaches zero around the zero point. To precisely identify the location of the zero point, pulse compression achieved by correlating the chirped photocurrent with the LFM signal is performed. Benefitting from the compression ratio of 2880, the zero point can be accurately localized by the correlation peak, as shown in Fig. 2(c). According to the location of the correlation peak, the frequency of the SUT is calculated to be 7.056 GHz, which is obviously more accurate than that achieved by directly observing the zero point. To demonstrate the multi-frequency measurement capability, a multi-frequency signal comprised of 13 and 18 GHz components is used to serve as the SUT. After chirped pulse compression, two correlation peaks are obtained, which can be clearly distinguished, as shown in Fig. 2(d). The measured frequencies are, respectively, 13.065 GHz and 18.033 GHz, indicating that the accuracy has no deterioration in the multi-frequency measurement. Furthermore, holding one frequency fixed at 3 GHz and sweeping a second frequency from 4 to 18 GHz in steps of 1 GHz, the measurement results are shown in Fig. 2(e), which demonstrates the capability for multi-frequency measurement over a full band (3–18 GHz).
![]()
Figure 2.(a) Waveforms of the photocurrents when tuning the frequency of the SUT from 3 to 18 GHz; (b) the zoom-in view of the zero point; (c) the correlation peak for 7 GHz SUT; (d) the two correlation peaks of a multi-frequency signal comprising 13 and 18 GHz components; (e) measurement results of a fixed 3 GHz component plus a sweeping second frequency.
Figure 3 shows the experimentally measured frequencies and measurement errors. As can be seen, the measured frequencies from 3 to 18 GHz are linearly fitted. The R-square is as large as 0.99995, which indicates that the measurement system has high linearity. Additionally, the frequency accuracy is better than , as shown in Fig. 3. It should be noted that the measurement accuracy of the proposed IFM method can be much higher. However, the relatively poor frequency stabilities of the TLS and the LD in the measurement system introduce considerable measurement errors. On the one hand, the TLS and the LD are free-running. The frequency detuning drifts the zero point and induces the major measurement error. On the other hand, the optical frequency-swept signals emitted from the LD at the same driving current in different sweeping periods have slight frequency differences, which introduce additional delay for the zero points and contribute additional measurement error. It is believed that, by employing a photonics-based LFM source[
![]()
Figure 3.Measured results with linear fitting and the measurement errors.
4. Conclusion
In conclusion, an instantaneous multi-frequency measurement method based on chirped pulse compression was proposed and experimentally demonstrated. Instantaneous single- and multi-frequency measurements were successfully achieved in the experiment. The measurement results show a frequency accuracy of better than within a frequency measurement range from 3 to 18 GHz. Potentially, sub-MHz accuracy and a hundred-GHz measurement range are available in theory. It is worth mentioning that, by employing optical time-division multiplexing and radio over fiber (RoF), the multi-SUT and remote measurements are achievable, which would be attractive to the distributed systems such as distributed radar systems and electronic warfare systems.
References
[1] D. Zhu, S. L. Pan. Broadband cognitive radio enabled by photonics. J. Lightwave Technol., 38, 3076(2020).
[2] P. W. East. Fifty years of instantaneous frequency measurement. IET Radar Sonar Navigat., 6, 112(2012).
[3] J. Yao. Microwave photonics. J. Lightwave Technol., 27, 314(2009).
[4] X. Zou, B. Lu, W. Pan, L. Yan, A. Stöhr, J. Yao. Photonics for microwave measurements. Laser Photon. Rev., 10, 711(2016).
[5] H. Emami, M. Hajihashemi, S. E. Alavi, M. Ghanbarisabagh. Simultaneous echo power and Doppler frequency measurement system based on microwave photonics technology. IEEE Trans. Instrum. Meas., 66, 508(2017).
[6] S. Pan, J. Yao. Photonics-based broadband microwave measurement. J. Lightwave Technol., 35, 3498(2017).
[7] X. Zou, S. Pan, J. Yao. Instantaneous microwave frequency measurement with improved measurement range and resolution based on simultaneous phase modulation and intensity modulation. J. Lightwave Technol., 27, 5314(2009).
[8] Z. Li, C. Wang, M. Li, H. Chi, X. Zhang, J. Yao. Instantaneous microwave frequency measurement using a special fiber Bragg grating. IEEE Microwave Wireless Compon. Lett., 21, 52(2011).
[9] D. P. Wang, K. Xu, J. Dai, Z. L. Wu, Y. F. Ji, J. T. Lin. Photonic-assisted approach for instantaneous microwave frequency measurement with tunable range by using Mach–Zehnder interferometers. Chin. Opt. Lett., 11, 020604(2013).
[10] X. Y. Han, S. T. Zhang, C. Tong, N. N. Shi, Y. Y. Gu, M. S. Zhao. Photonic approach to microwave frequency measurement with extended range based on phase modulation. Chin. Opt. Lett., 11, 050604(2013).
[11] B. W. Zhang, X. C. Wang, S. L. Pan. Photonics-based instantaneous multi-parameter measurement of a linear frequency modulation microwave signal. J. Lightwave Technol., 36, 2589(2018).
[12] B. Zhu, W. Zhang, S. Pan, J. Yao. High-sensitivity instantaneous microwave frequency measurement based on a silicon photonic integrated Fano resonator. J. Lightwave Technol., 37, 2527(2019).
[13] S. T. Winnall, A. C. Lindsay, M. W. Austin, J. Canning, A. Mitchell. A microwave channelizer and spectroscope based on an integrated optical Bragg-grating Fabry–Pérot and integrated hybrid Fresnel lens system. IEEE Trans. Microwave Theory Technol., 54, 868(2006).
[14] J. M. Heaton, C. D. Watson, S. B. Jones, M. M. Bourke, C. M. Boyne, G. W. Smith, D. R. Wight. Sixteen channel (1- to 16-GHz) microwave spectrum analyzer device based on a phased array of GaAs/AlGaAs electro-optic waveguide delay lines. Proc. SPIE, 3278, 245(1998).
[15] X. Zou, W. Li, W. Pan, L. Yan, J. Yao. Photonic-assisted microwave channelizer with improved channel characteristics based on spectrum controlled stimulated Brillouin scattering. IEEE Trans. Microwave Theory Technol., 61, 3470(2013).
[16] L. V. Nguyen. Microwave photonic technique for frequency measurement of simultaneous signals. IEEE Photon. Technol. Lett, 21, 642(2009).
[17] T. A. Nguyen, E. H.W. Chan, R. A. Minasian. Instantaneous high-resolution multiple-frequency measurement system based on frequency-to-time mapping technique. Opt. Lett., 39, 2419(2014).
[18] T. A. Nguyen, E. H.W. Chan, R. A. Minasian. Photonic multiple frequency measurement using a frequency shifting recirculating delay line structure. J. Lightwave Technol., 32, 3831(2014).
[19] B. Zhu, M. Xue, C. Yu, S. Pan. Broadband and high-precision instantaneous frequency measurement using linearly frequency-modulated waveform and pulse compression processing, 1(2019).
[20] J. Shi, F. Zhang, D. Ben, S. Pan. Photonic-assisted single system for microwave frequency and phase noise measurement. Chin. Opt. Lett., 18, 092501(2020).
[21] R. Wang, S. Xu, J. Chen, W. Zou. Ultra-wideband signal acquisition by use of channel-interleaved photonic analog-to-digital converter under the assistance of dilated fully convolutional network. Chin. Opt. Lett., 18, 123901(2020).
[22] Y. Zhou, F. Zhang, S. Pan. Instantaneous frequency analysis of broadband LFM signals by photonics-assisted equivalent frequency sampling. Chin. Opt. Lett., 19, 013901(2021).
[23] G. A. Sefler, T. J. Shaw, G. C. Valley. Demonstration of speckle-based compressive sensing system for recovering RF signals. Opt. Express, 26, 21390(2018).
[24] A. C. Scofield, G. Sefler, J. Shaw, G. Valley. Recent results using laser speckle in multimode waveguides for random projections. Proc. SPIE, 10937, 109370B(2019).
[25] P. Berger, Y. Attal, M. Schwarz, S. Molin, A. Louchet-Chauvet, T. Chanelière, J.-L. L. Gouët, D. Dolfi, L. Morvan. RF spectrum analyzer for pulsed signals: ultra-wide instantaneous bandwidth, high sensitivity, and high time-resolution. J. Lightwave Technol., 34, 4658(2016).
[26] S. R. Konatham, R. Maram, L. R. Cortés, J. H. Chang, J. Azaa. Real-time gap-free dynamic waveform spectral analysis with nanosecond resolutions through analog signal processing. Nat. Commun., 11, 3309(2020).
[27] S. L. Pan, Y. M. Zhang. Microwave photonic radars. J. Lightwave Technol., 38, 5450(2020).

Set citation alerts for the article
Please enter your email address
© Copyright 2018-2021 | Chinese Laser Press. All Rights Reserved 沪ICP备15018463号-20