• Chinese Optics Letters
  • Vol. 14, Issue 4, 041601 (2016)
Lei He1、*, Zhenhong Jia2, and Jun Zhou3
Author Affiliations
  • 1School of Physical Science and Technology, Xinjiang University, Urumqi 830046, China
  • 2School of Information Science and Engineering, Xinjiang University, Urumqi 830046, China
  • 3Department of Physics, Ningbo University, Ningbo 315211, China
  • show less
    DOI: 10.3788/COL201614.041601 Cite this Article Set citation alerts
    Lei He, Zhenhong Jia, Jun Zhou. Properties of fluorescence based on the immobilization of graphene oxide quantum dots in nanostructured porous silicon films[J]. Chinese Optics Letters, 2016, 14(4): 041601 Copy Citation Text show less
    (a) SEM image of QDs used in the research. (b) Photoluminescence spectra of QDs (0.5 mg/mL) and original PSi sample at an excitation wavelength of 370 nm.
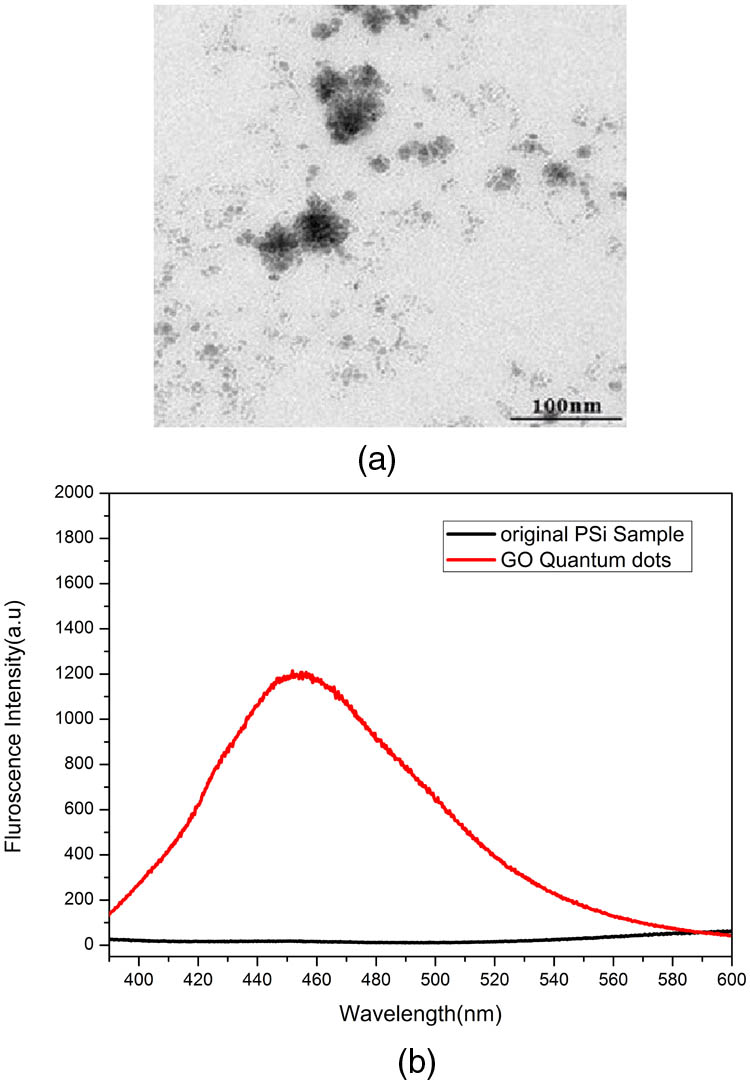
    Fig. 1. (a) SEM image of QDs used in the research. (b) Photoluminescence spectra of QDs (0.5 mg/mL) and original PSi sample at an excitation wavelength of 370 nm.
    Top-view and cross-sectional view SEM images of PSi sample.
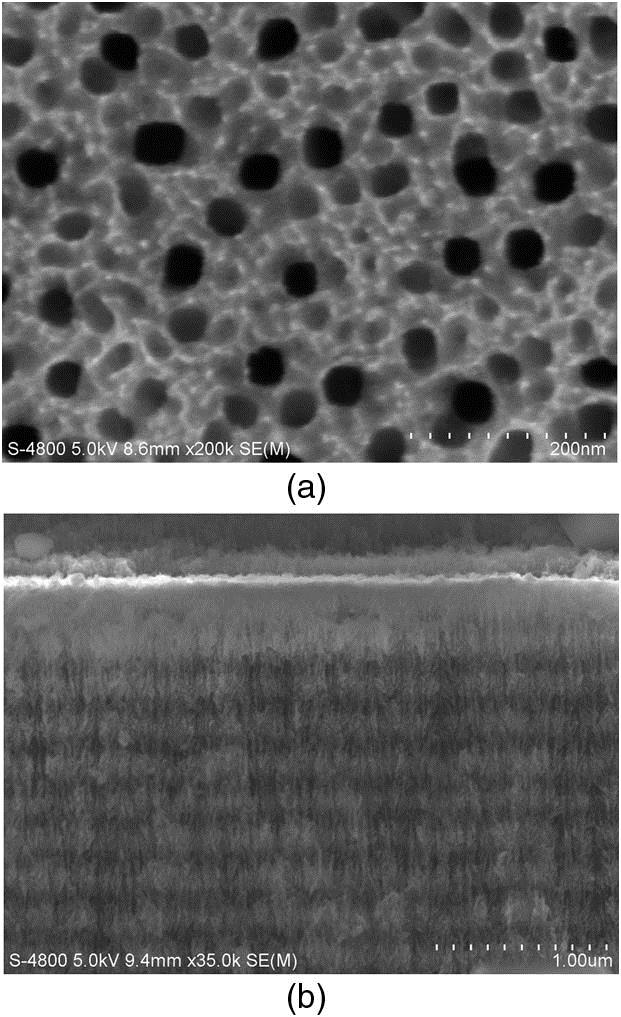
    Fig. 2. Top-view and cross-sectional view SEM images of PSi sample.
    Red shift of multilayer PSi sample after the infiltration of QDs.
    Fig. 3. Red shift of multilayer PSi sample after the infiltration of QDs.
    Fluorescence intensity of the above PSi sample with or without QDs coupled.
    Fig. 4. Fluorescence intensity of the above PSi sample with or without QDs coupled.
    Reflectance spectra of two types of PSi devices after coupling with GOQDs’ (sample 1) high reflection band coinciding with the fluorescence emission spectra. In sample 2, the high reflection band was far beyond the fluorescence emission spectra of the GOQDs.
    Fig. 5. Reflectance spectra of two types of PSi devices after coupling with GOQDs’ (sample 1) high reflection band coinciding with the fluorescence emission spectra. In sample 2, the high reflection band was far beyond the fluorescence emission spectra of the GOQDs.
    Fluorescence emission spectrum of the infiltrated PSi sample: fluorescence of the mutilayer sample (1), whose high reflectance band is located at fluorescence (black line), fluorescence of mutilayer sample (2), whose high reflectance was beyond the fluorescence emission spectra (red line), and the fluorescence of the single-layer sample (blue line).
    Fig. 6. Fluorescence emission spectrum of the infiltrated PSi sample: fluorescence of the mutilayer sample (1), whose high reflectance band is located at fluorescence (black line), fluorescence of mutilayer sample (2), whose high reflectance was beyond the fluorescence emission spectra (red line), and the fluorescence of the single-layer sample (blue line).
    SpectrogramStateCOSiTotal 
    1on17.0424.7658.20100.00(According to the weight percentage)
    2on15.2122.9961.80100.00
    Average16.1223.8860.00100.00
    Standard deviation1.291.252.54
    Maximum17.0424.7661.80
    15.2122.9958.20
    Table 1. Element Content Table of the Doped PSi Sample by Energy-Dispersive Spectrometer
    Lei He, Zhenhong Jia, Jun Zhou. Properties of fluorescence based on the immobilization of graphene oxide quantum dots in nanostructured porous silicon films[J]. Chinese Optics Letters, 2016, 14(4): 041601
    Download Citation