
Peichao Chen, Citian You, Panfeng Ding. Pattern Recognition of Intrusion Events in Perimeter Defense Areas of Optical Fiber[J]. Chinese Journal of Lasers, 2019, 46(10): 1006001
- Chinese Journal of Lasers
- Vol. 46, Issue 10, 1006001 (2019)
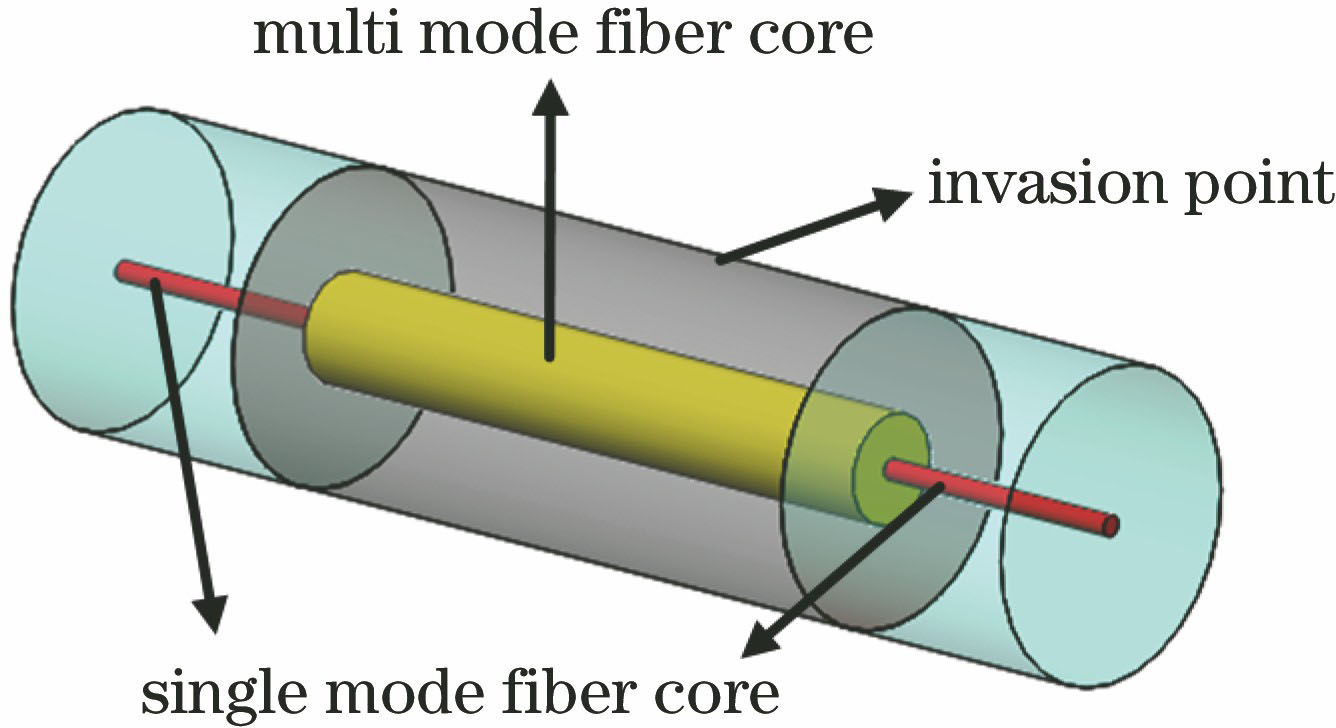
Fig. 1. SMS fiber structural diagram
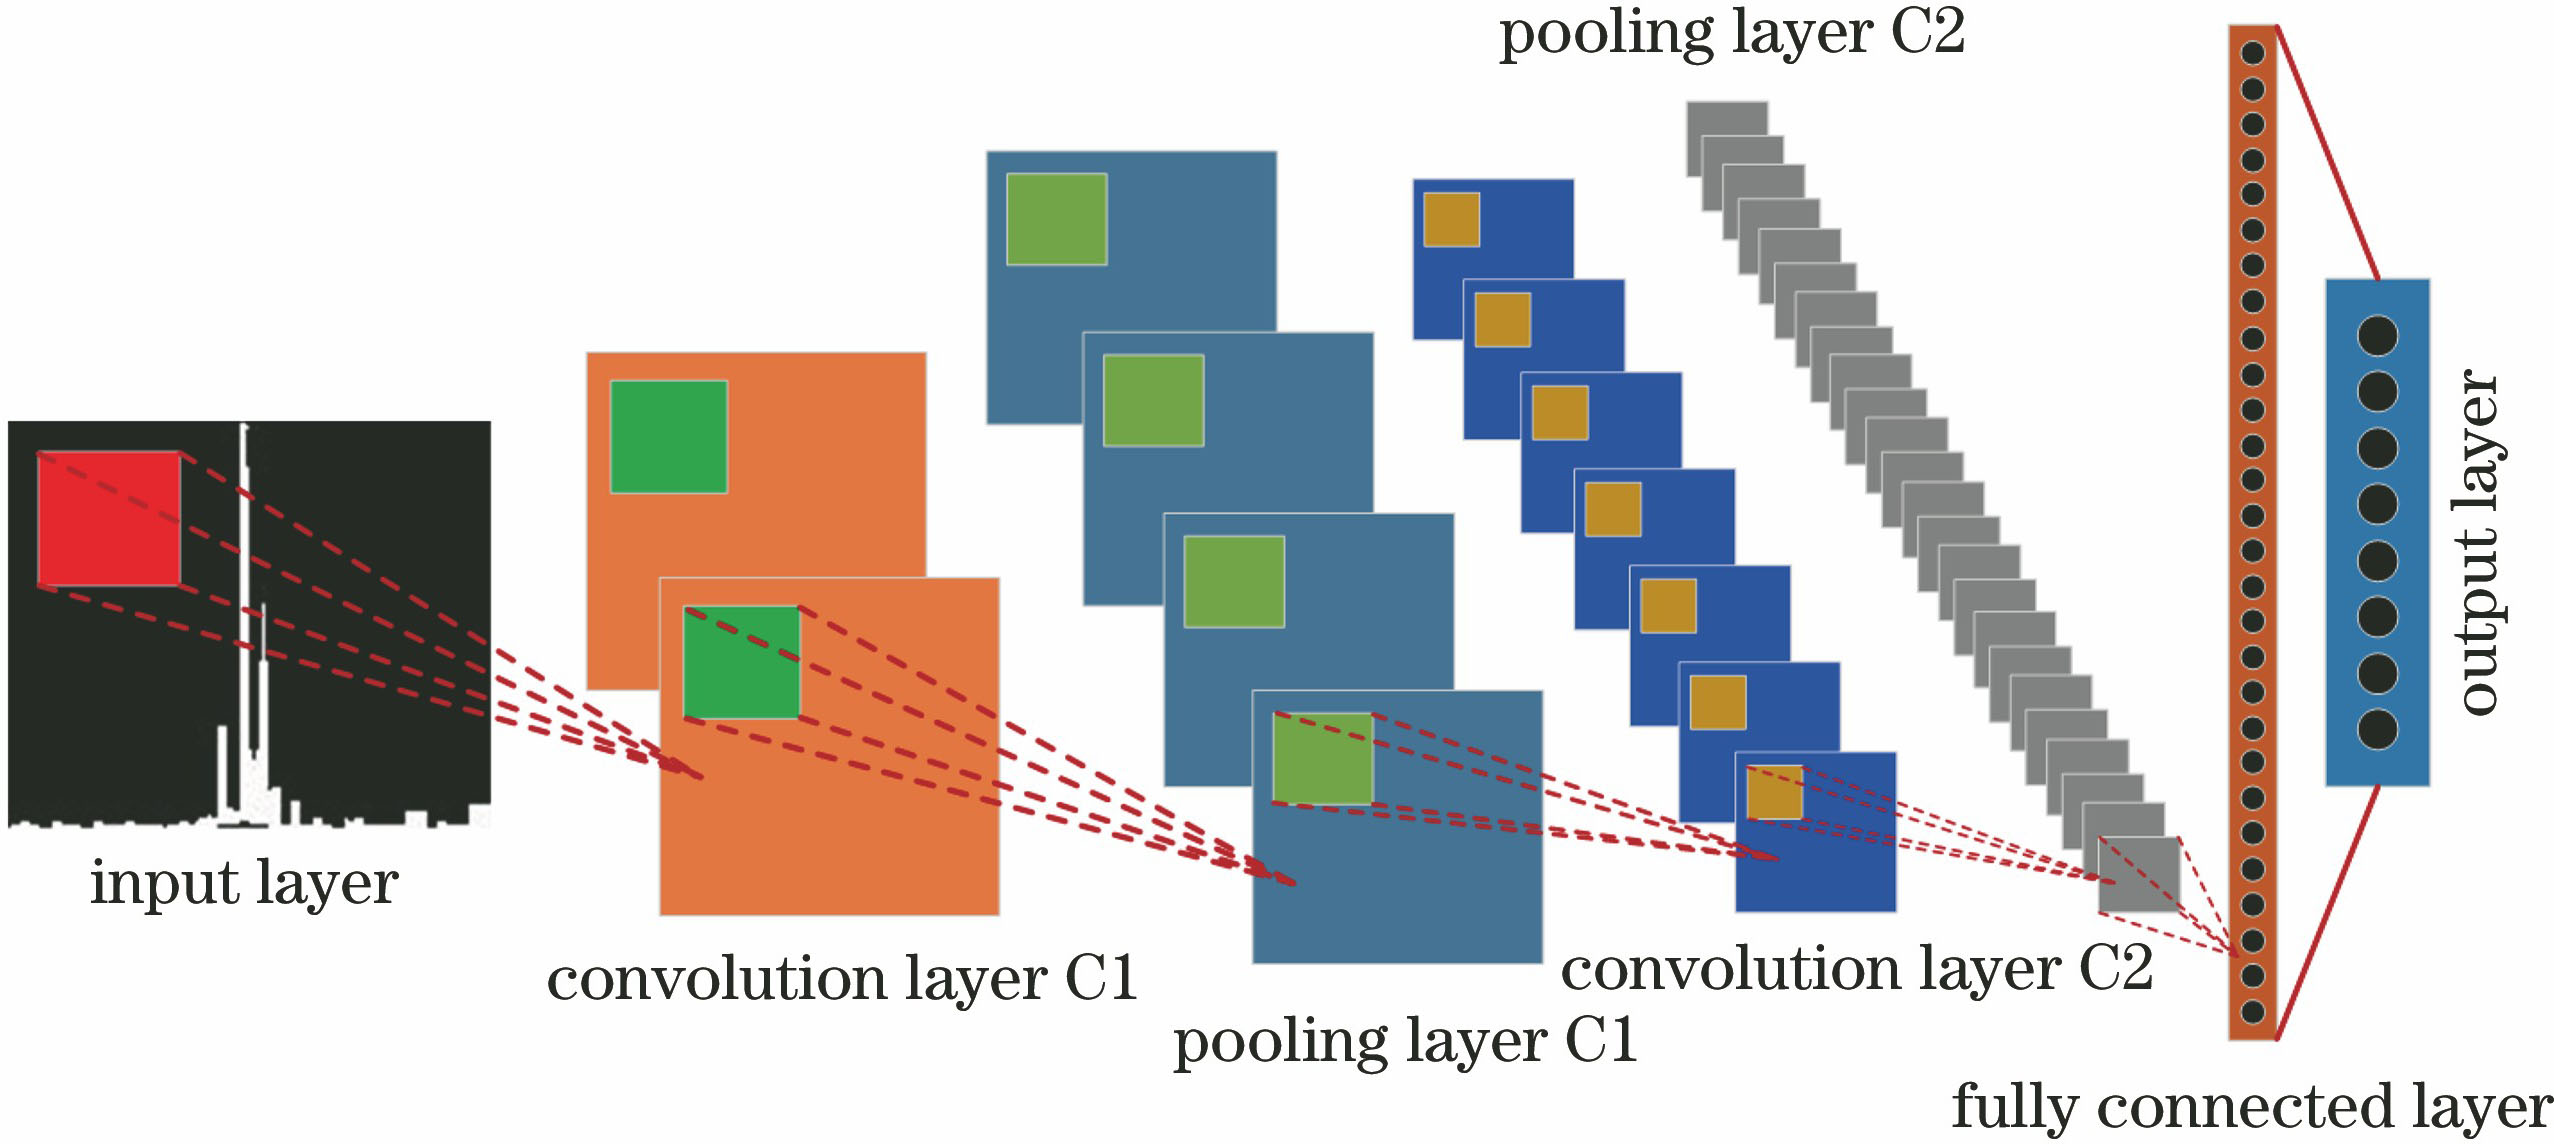
Fig. 2. Structure of convolutional neural network
Fig. 3. Experimental diagrams of pattern recognition in perimeter defense area. (a) Knocking; (b) shaking; (c) winding; (d) raining
Fig. 4. Normalized waveforms of four intrusion signals. (a) Knocking; (b) shaking; (c) winding; (d) raining
Fig. 5. STFT time-frequency diagrams of two kinds of window functions for processing four intrusion events.(a)(c)(e)(g) Time-frequency diagrams of knocking, shaking, winding, and raining signals after passing through the Hanning window;(b)(d)(f)(h) time-frequency diagrams of knocking, shaking, winding, and raining signals after passing through the Kaiser window
Fig. 6. Binarization diagrams of disturbance signals at different resolutions. (a)(c)(e)(g) Time-frequency binarization diagrams of knocking, shaking, winding, and raining signals processed by Kaiser window with window length of 9600; (b)(d)(f)(h) time-frequency binarization diagrams of knocking, shaking, winding, and raining signals processed by Kaiser window with window length of 4800
Fig. 7. Iteration loss diagram of three network models with Hanning window length of 4800
Fig. 8. Recognition rates of Hanning window and Kaisei window with window lengths of 4800 and 9600, respectively
Fig. 9. Time domain diagrams of knocking signal with different Gaussian noise. (a) SNR is 40 dB; (b) SNR is 50 dB; (c) SNR is 60 dB; (d) SNR is 70 dB
Fig. 10. Recognition rates of intrusion signals with different SNR. (a) Knocking; (b) shaking; (c) winding; (d) raining
Fig. 11. Identification results with noise signal
|
Table 1. Parameters and test results of different network models
|
Table 2. Comparison of parameters of different input data formats
| ||||||||||||||||||||||||||||||||
Table 3. Identification results of artificial and non-human intrusion signals

Set citation alerts for the article
Please enter your email address
© Copyright 2018-2021 | Chinese Laser Press. All Rights Reserved 沪ICP备15018463号-20