
Yu-Han Mei, Yue Shao, Zhi-Hong Hang. Microwave experimental platform to demonstrate topology physics based on tight-binding model [J]. Acta Physica Sinica, 2019, 68(22): 227803-1
- Acta Physica Sinica
- Vol. 68, Issue 22, 227803-1 (2019)
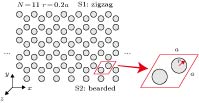
Fig. 1. The structure of a honeycomb-lattice graphene-like photonic crystal. Its honeycomb unit cell is indicated in red. A ribbon of 11 dielectric cylinders along the y direction is considered and it is periodically arranged in the x direction. The photonic crystal ribbon has zigzag (S1), bearded (S2) edges. The radius of cylinders shown here is r = 0.2a , where a is the lattice constant.
二维类石墨烯光子晶体结构示意图, 其蜂巢晶格原胞用红线标记. y 轴方向上11个介质柱构成一个超原胞, 沿着x 轴无限周期排列. 介质柱阵列的S1边界为之字形(zigzag)界面, S2为胡须形(bearded)界面, 介质柱半径r = 0.2a , a 是蜂巢晶格的晶格常数
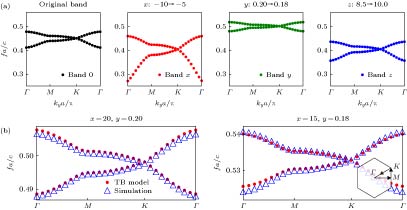
Fig. 2. (a) A Dirac cone dispersion appears at K point for the lowest two photonic bands of the honeycomb photonic crystal structure we studied. Band 0 represents the band diagram when x = –10, y = 0.2, z = 8.5; Band x , y and z correspond to the situations that only one parameter from that of band 0 is changed: x = –5 (band x ), y = 0.18 (band y ), z = 10 (band z ); (b) the comparison between calculated lowest two photonic bulk bands of band left (x = –20, y = 0.2, z = 8.5) and band right (x = –15, y = 0.18, z = 8.5) (in red dots) and corresponding bands calculated with tight-binding model with fitted parameters using equations (5 ) and (6 ) (in hollow blue triangles).
(a)六角光子晶体最低的两条能带, 在布里渊区边界K 点因为蜂巢晶格对称性具有狄拉克点. Band 0 对应了x = –10, y = 0.2, z = 8.5的能带, 即初始条件. Band x , y , z 在保持另两个初始值不变时, 改变了x = –5 (band x ), y = 0.18 (band y ), z = 10 (band z ); (b) 左侧band (x = –20, y = 0.2, z = 8.5)和右侧band (x = –15, y = 0.18, z = 8.5) 对比了COMSOL计算的能带(点)以及用(5 )式和(6 )式拟合的紧束缚模型计算得到的能带(三角形)
Fig. 3. The energy bands for a honeycomb-graphene-like photonic crystal ribbon (the background constant x = –20, filling ratio y = 0.2). Here we used the equations (1 ), (5 ) and (6 ) to derive the TB solution(red), as simulation results are marked blue. The supercell is depicted in the right-lower corner.
宽度为11且有一个之字形边界和一个胡须形边界的光子晶体类石墨烯带超原胞, 利用(1 )式, (5 )式和(6 )式的紧束缚模型得到的能带图像(红色)和仿真结果(蓝色)的对比; 其中背景常数x = –20, 占空比 y = 0.2, 超原胞如图右下角所示
Fig. 4. Band dispersion (in red dots) of Tamm-like bearded edge states calculated using photonic crystal system with background permittivity
= –10. The bulk bands are in blue dots. Their corresponding eigenfield distributions localized on bearded edge are shown in the lower panels: (a) Lower bands; (b) upper bands.
利用负背景光子晶体系统数值计算得到的局域在胡须界面上的两个Tamm态, 界面态的色散用红色和体带(蓝色)区分. 此时负背景介电常数为–10, 上体带和下体带各有一Tamm态; 其对应的本征场在下方显示 (a) 下体带; (b) 上体带
Fig. 5. In the metallic background, photonic energy bands match well with the bands (Red) calculated with effective background constant (Blue). However, Tight Binding model’s result (Green) shows small variance compared to the real bands. In the schematic cell structure, bigger circle represents dielectric cylinder, while smaller circle represents thin metallic rod inserted.金属柱背景下, 氧化铝蜂窝结构的光子能带(红色), 和其对应的背景替换为有效介质(蓝色)后得到的能带结果符合, 但用紧束缚模型(绿色)计算得到的能带略有差别. 原胞内的大圆代表介质柱, 小圆代表密集插入的细金属柱
| |||||||||||||||
Table 1.
Relationship between onsite energy, coupling ratio and parameters.
参数和位能以及耦合系数的关系

Set citation alerts for the article
Please enter your email address
© Copyright 2018-2021 | Chinese Laser Press. All Rights Reserved 沪ICP备15018463号-20