• Journal of Natural Resources
  • Vol. 35, Issue 9, 2205 (2020)
Pei-pei HE1、2, Jun-biao ZHANG1、2、*, Ke HE1、2, and Zhu-kang CHEN1、2
Author Affiliations
  • 1College of Economics & Management, Huazhong Agricultural University, Wuhan 430070, China
  • 2Hubei Rural Development Research Center, Wuhan 430070, China
  • show less
    DOI: 10.31497/zrzyxb.20200913 Cite this Article
    Pei-pei HE, Jun-biao ZHANG, Ke HE, Zhu-kang CHEN. Why there is a low-carbon efficiency illusion in agricultural production: Evidence from Chinese provincial panel data in 1997-2016[J]. Journal of Natural Resources, 2020, 35(9): 2205 Copy Citation Text show less
    National agricultural low-carbon efficiency trends from 1997 to 2016
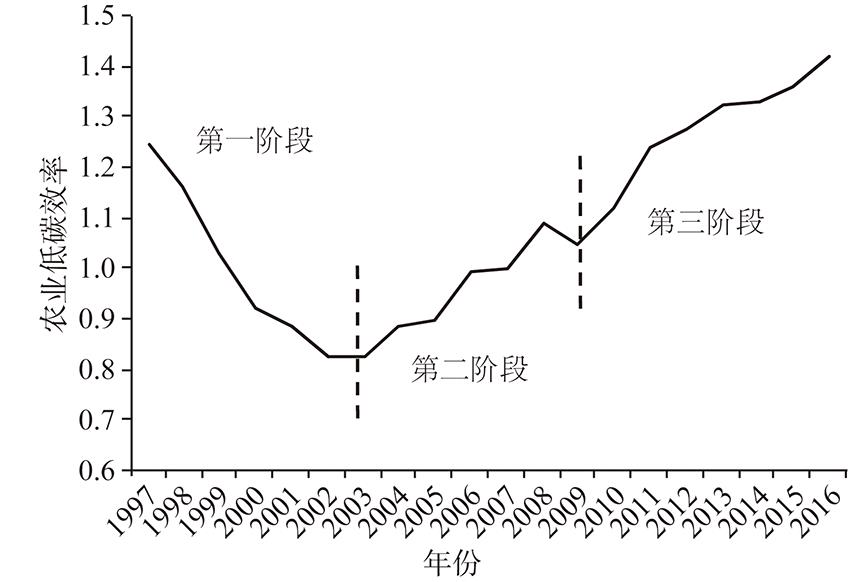
    Fig. 1. National agricultural low-carbon efficiency trends from 1997 to 2016
    Regional agricultural low-carbon efficiency trends from 1997 to 2016
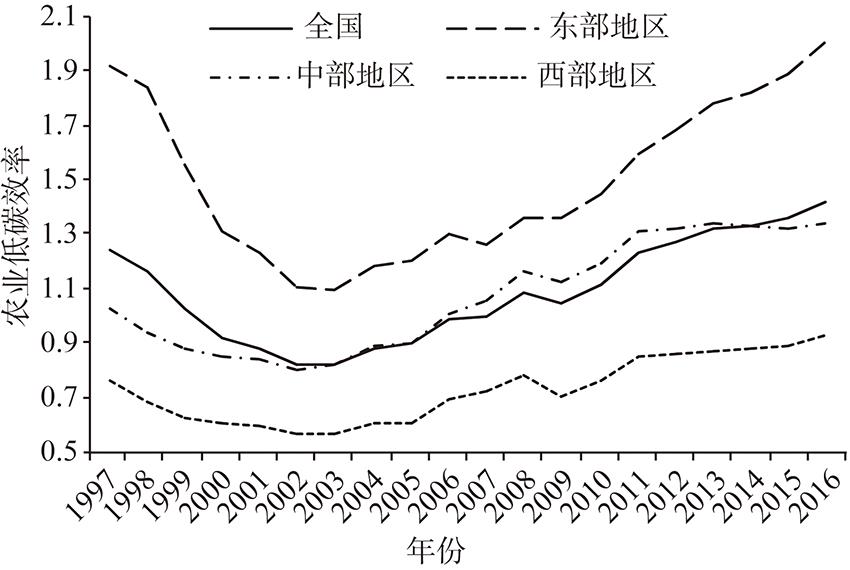
    Fig. 2. Regional agricultural low-carbon efficiency trends from 1997 to 2016
    一级指标二级指标变量及说明
    投入指标劳动力投入农林牧渔业从业人员/万人
    土地投入农作物播种总面积/千hm2
    化肥投入化肥施用量/折纯,万t
    农药投入农药施用量/万t
    农膜投入农膜使用量/万t
    农业机械动力投入农业机械总动力/万kW
    灌溉投入有效灌溉面积/千hm2
    期望产出指标农林牧渔总产值农林牧渔总产值/亿元
    非期望产出指标农业碳排放化肥、农药、农膜、农用柴油、翻耕、农业灌溉、
    主要畜禽、水产养殖碳排放总量/万t
    Table 1. Indicators of agricultural production input and output
    省(市、
    区)
    1997—2016年1997—2003年2004—2016年省(市、
    区)
    1997—2016年1997—2003年2004—2016年
    排名均值排名均值排名均值排名均值排名均值排名均值
    广东11.87741.58522.034河北171.040140.939191.095
    浙江21.85931.73531.926辽宁180.989130.960201.005
    福建31.83521.76141.875山东190.981220.688161.139
    上海41.770111.12312.119山西200.968230.667181.130
    江苏51.68451.49261.787贵州210.963250.642171.136
    北京61.64671.24151.865河南220.903190.799210.959
    海南71.58513.084230.778黑龙江230.823200.748220.863
    湖南81.47881.16571.646吉林240.699210.689240.704
    重庆91.30891.16391.386云南250.641270.689250.662
    天津101.27561.269131.279内蒙古260.604240.663270.571
    安徽111.272120.98181.430宁夏270.602260.614260.596
    江西121.272101.126111.351甘肃280.433280.469290.414
    湖北131.216160.912101.379新疆290.428290.375280.457
    广西141.161150.921121.291青海300.329300.280300.355
    陕西151.109170.887141.228西藏310.138310.157310.128
    四川161.099180.865151.225全国1.0960.9871.155
    Table 2. Average and ranking of agricultural low-carbon efficiency in each provincial-level region
    省(市、
    区)
    2007年2008年2009年2010年2011年2012年2013年2014年2015年2016年
    北京-94.0540.0460.477α-0.4310.031-0.113-0.60118.128α13.906α-3.694
    天津-0.2030.3412.8320.046-0.1240.381-0.091-0.161-1.8770.566
    河北0.596-0.947-2.192-0.1160.0330.5450.284-1.5290.140α2.479α
    山西-1.213-0.0280.1320.0180.5263.1520.4001.2500.406α-1.154
    内蒙古0.7331.13210.5740.519-0.2061.1340.984-59.163-1.6780.727α
    辽宁1.6630.1731.5601.115-0.1290.2280.577-0.2780.876-0.085
    吉林1.079-0.2192.8510.2000.1531.1500.303-4.325-73.6120.147α
    黑龙江0.966-0.09810.0781.2840.2970.5010.16724.299-0.4890.032α
    上海-0.9690.546-5.0071.315-0.363-10.039-2.9641.630α-8.174-2.393
    江苏0.3500.2853.5310.3490.0820.253-0.169-0.045-0.377-0.724
    浙江1.1840.5380.5890.1950.1410.8420.7373.198α-1.139-0.567
    安徽0.3970.075-10.0420.5330.3552.0150.7022.108-4.684-0.850
    福建2.5070.3010.244α-0.0150.0530.3270.0650.4670.5880.152
    江西1.8570.2530.550α-0.0310.0640.4670.1011.4001.1280.228
    山东0.1340.6012.5590.6810.0901.1600.7961.844-2.7330.363α
    河南0.473-0.37318.6600.044-0.0980.253-0.810-3.4600.252α-0.775
    湖北0.5230.262-1.5830.2590.0860.1411.194-6.050-2.085-0.017
    湖南0.4480.371-0.6980.3690.1080.2532.8282.698-0.819-0.644
    广东2.3430.104-1.5870.3230.3270.441-0.0480.6670.674-0.123
    广西0.5130.492-1.1130.4220.140-6.2110.9701.5610.6300.278
    海南-6.3980.385-0.7790.3540.544-2.085-13.8350.73829.899-1.969
    重庆2.1490.510-7.2090.5870.1930.4931.0073.1100.592-0.140
    四川0.1700.200-0.3490.0570.122-0.079-31.5802.866-0.022-0.423
    贵州0.4630.603-0.590-0.566-0.1000.1990.3860.2470.181-0.055
    云南1.1500.5425.0824.1980.2440.8410.2978.391-0.8021.189
    西藏1.3254.138-4.138-3.2440.940-3.1490.751-1.3560.309-0.395
    陕西0.6240.153-55.0590.1640.1971.8970.500-0.812-0.3620.682
    甘肃0.8970.3392.4790.7732.4940.6490.9104.3791.545-0.938
    青海-0.279-0.108-8.6560.5670.847-0.4661.1790.931-0.1274.082
    宁夏1.7950.539-7.2370.4030.2091.7100.5640.225α0.155-0.404
    新疆0.8200.702-0.1130.075-4.3700.8141.56517.4730.431α-16.096
    存在效
    率幻觉
    2525122524242317117
    Table 3. Degree of agricultural low-carbon efficiency illusion in each provincial-level region from 2007 to 2016
    影响因素变量表征说明及单位影响效应预判
    农业经济发展水平(ael农林牧渔总产值/农林牧渔业从业人员/(万元/人)负向
    农业生产节能技术水平(etl农业机械总动力/农林牧渔总产值/(kW/亿元)负向
    农业发展重视程度(cp地方财政农林水事务支出/地方财政一般预算支出负向
    农业产业结构(is农牧业产值/农林牧渔总产值未知
    农业规模化水平(sc农村居民家庭经营耕地面积/(亩/人)未知
    农业受灾率(dr农作物受灾面积/农作物播种总面积正向
    农业人力资本(edu农村家庭劳动力平均受教育年限/年负向
    Table 4. Factors affecting the degree of agricultural low-carbon efficiency illusion
    解释变量双向固定效应2SLS
    IIIIIIIVV
    lnael-0.499-0.808*-0.531
    (0.430)(0.456)(0.447)
    lnael_10.984***
    (0.023)
    lnetl_10.116**
    (0.048)
    lnetl-0.963*-1.283**-0.013-2.099***
    (0.509)(0.592)(0.055)(0.585)
    cp-15.988***-20.302***-14.513***0.118-14.368**
    (5.313)(3.654)(4.951)(0.211)(5.768)
    is-1.989-2.675-2.626-0.153-4.646
    (3.623)(4.153)(4.383)(0.155)(3.932)
    lnsc0.6360.980*1.113**-0.044**1.053*
    (0.443)(0.513)(0.529)(0.017)(0.601)
    dr0.8941.336*0.957-0.0301.220*
    (0.686)(0.685)(0.686)(0.034)(0.738)
    lnedu3.7204.306**6.071**0.0944.518*
    (2.425)(1.985)(2.221)(0.162)(2.407)
    常数项-5.132-4.919-8.753-0.071-3.162
    (6.095)(5.130)(5.783)(0.433)(5.971)
    R20.0880.0940.1040.965
    不可识别检验0.000
    弱工具检验1225.144***
    Sargan检验0.225
    Table 5. Estimation of factors affecting the degree of agricultural low-carbon efficiency illusion
    Pei-pei HE, Jun-biao ZHANG, Ke HE, Zhu-kang CHEN. Why there is a low-carbon efficiency illusion in agricultural production: Evidence from Chinese provincial panel data in 1997-2016[J]. Journal of Natural Resources, 2020, 35(9): 2205
    Download Citation