• Chinese Optics Letters
  • Vol. 19, Issue 12, 123202 (2021)
Weifeng Yang1、2、3、*, Yichong Lin2, Xueyi Chen2, Yuxuan Xu2, Hongdan Zhang2、3, Marcelo Ciappina4、5, and Xiaohong Song1、2、3、**
Author Affiliations
  • 1School of Science, Hainan University, Haikou 570228, China
  • 2Research Center for Advanced Optics and Photoelectronics, Department of Physics, College of Science, Shantou University, Shantou 515063, China
  • 3Institute of Mathematics, Shantou University, Shantou 515063, China
  • 4Physics Program, Guangdong Technion - Israel Institute of Technology, Shantou 515063, China
  • 5Technion - Israel Institute of Technology, Haifa 32000, Israel
  • show less
    DOI: 10.3788/COL202119.123202 Cite this Article Set citation alerts
    Weifeng Yang, Yichong Lin, Xueyi Chen, Yuxuan Xu, Hongdan Zhang, Marcelo Ciappina, Xiaohong Song. Wave mixing and high-harmonic generation enhancement by a two-color field driven dielectric metasurface [Invited][J]. Chinese Optics Letters, 2021, 19(12): 123202 Copy Citation Text show less
    (a) Scheme of the Si-based metasurface periodic arrangement on a sapphire substrate. (b) A single simulation cell. The geometrical parameters are a = 200 nm, b = 700 nm, r = 210 nm, g = 70 nm, t = 120 nm, P1 = 750 nm, and P2 = 750 nm. (c) Simulated transmittance spectrum of the single cell. One peak in the transmittance spectrum appears at a wavelength of 1341 nm, and another one is observed at a wavelength of 1146 nm. (d), (f), (h) Plots in the x–y plane of the electric, magnetic, and Poynting field patterns at a wavelength of 1341 nm, respectively. (e), (g), (i) Plots in the x–y plane of the electric, magnetic, and Poynting field patterns at a wavelength of 1146 nm, respectively. The white lines indicate the location of the nanostructures.
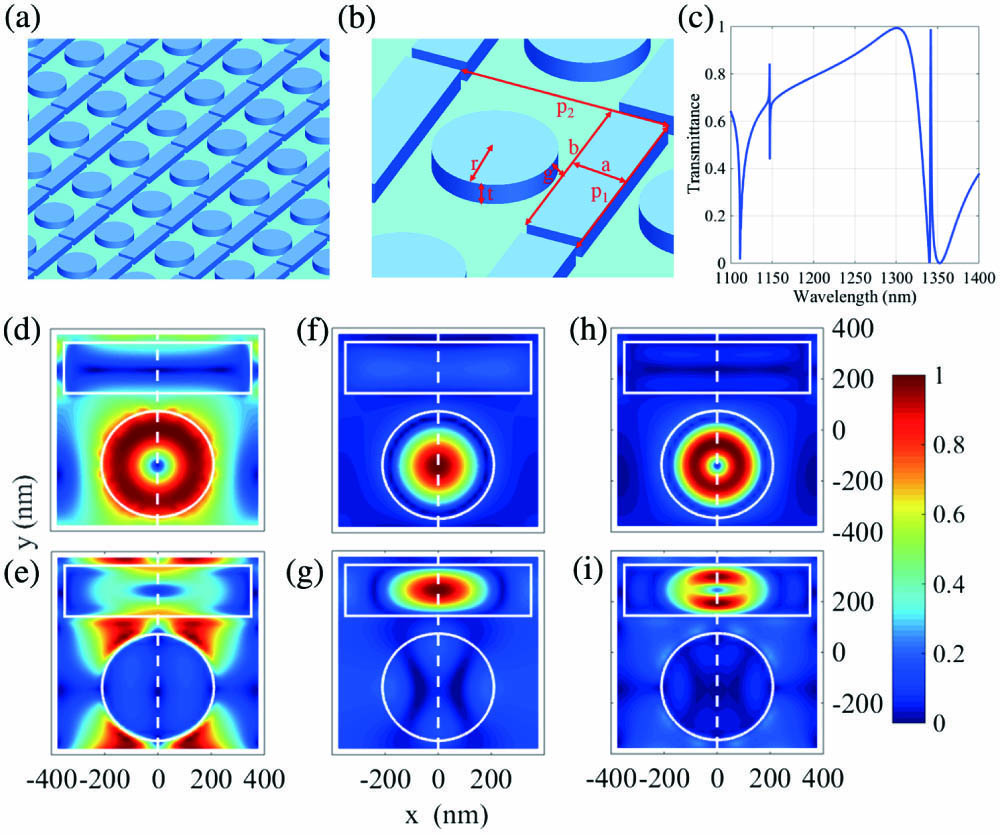
    Fig. 1. (a) Scheme of the Si-based metasurface periodic arrangement on a sapphire substrate. (b) A single simulation cell. The geometrical parameters are a = 200 nm, b = 700 nm, r = 210 nm, g = 70 nm, t = 120 nm, P1 = 750 nm, and P2 = 750 nm. (c) Simulated transmittance spectrum of the single cell. One peak in the transmittance spectrum appears at a wavelength of 1341 nm, and another one is observed at a wavelength of 1146 nm. (d), (f), (h) Plots in the xy plane of the electric, magnetic, and Poynting field patterns at a wavelength of 1341 nm, respectively. (e), (g), (i) Plots in the xy plane of the electric, magnetic, and Poynting field patterns at a wavelength of 1146 nm, respectively. The white lines indicate the location of the nanostructures.
    (a) Harmonic spectrum when the excitation pulse is centered at the first resonance wavelength λ1 = 1341 nm. (b) Harmonic spectrum when the excitation is a two-color field, formed by the combination of the resonant EIT wavelength (1341 nm) and its third harmonic. In both cases, the field is linearly polarized along the bar.
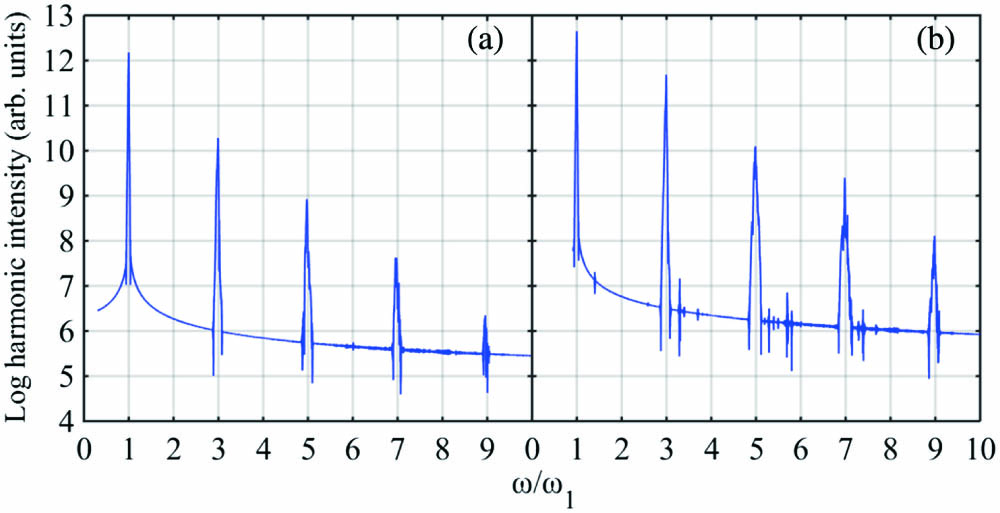
    Fig. 2. (a) Harmonic spectrum when the excitation pulse is centered at the first resonance wavelength λ1 = 1341 nm. (b) Harmonic spectrum when the excitation is a two-color field, formed by the combination of the resonant EIT wavelength (1341 nm) and its third harmonic. In both cases, the field is linearly polarized along the bar.
    Spectrum generated when the excitation pulse is a combination of the first resonance (resonant EIT peak) and the second resonance (1146 nm) wavelengths. The inset shows the zoom of the 1st, 3rd, and 5th harmonics of the spectrum. We label the additional frequencies around the third harmonic (see the text for more details). The driving field is linearly polarized along the bar.
    Fig. 3. Spectrum generated when the excitation pulse is a combination of the first resonance (resonant EIT peak) and the second resonance (1146 nm) wavelengths. The inset shows the zoom of the 1st, 3rd, and 5th harmonics of the spectrum. We label the additional frequencies around the third harmonic (see the text for more details). The driving field is linearly polarized along the bar.
    Relation between the relative phase of the triple frequency field and the third harmonic intensity.
    Fig. 4. Relation between the relative phase of the triple frequency field and the third harmonic intensity.
    (a) Simulated transmittance spectrum of the metasurface with the new geometrical parameters (see the text for details). (b) Simulated normalized electric field amplitude at the resonant wavelength λ3 = 800 nm in the x–y plane. The white lines indicate the location of the nanostructures.
    Fig. 5. (a) Simulated transmittance spectrum of the metasurface with the new geometrical parameters (see the text for details). (b) Simulated normalized electric field amplitude at the resonant wavelength λ3 = 800 nm in the xy plane. The white lines indicate the location of the nanostructures.
    (a) HHG for an excitation light pulse centered at 800 nm. (b) Two-color HHG spectrum for an incident field formed as a combination of the resonant frequency ω3 and its third harmonic. (c) Wave mixing spectrum generated by an excitation pulse formed as the combination of the first and second resonant wavelengths λ3 and λ4. In all cases, the field is linearly polarized along the bar.
    Fig. 6. (a) HHG for an excitation light pulse centered at 800 nm. (b) Two-color HHG spectrum for an incident field formed as a combination of the resonant frequency ω3 and its third harmonic. (c) Wave mixing spectrum generated by an excitation pulse formed as the combination of the first and second resonant wavelengths λ3 and λ4. In all cases, the field is linearly polarized along the bar.
    Weifeng Yang, Yichong Lin, Xueyi Chen, Yuxuan Xu, Hongdan Zhang, Marcelo Ciappina, Xiaohong Song. Wave mixing and high-harmonic generation enhancement by a two-color field driven dielectric metasurface [Invited][J]. Chinese Optics Letters, 2021, 19(12): 123202
    Download Citation