• Journal of Natural Resources
  • Vol. 35, Issue 1, 68 (2020)
Wu XIAO1、2、*, Wen-kai ZHANG2、3, Xue-jiao LYU2, and Xin-jing WANG4
Author Affiliations
  • 1School of Public Affairs, Zhejiang University, Hangzhou 310029, China
  • 2Institute of Land Reclamation and Ecological Restoration, China University of Mining and Technology (Beijing), Beijing 100083, China
  • 3Shanxi Key Laboratory of Resources, Environment and Disaster Monitoring, Shanxi Coal Geology Geophysical Surveying Exploration Institute, Jinzhong 030600, Shanxi, China
  • 4North China University of Water Resources and Electric Power, Zhengzhou 450045, China
  • show less
    DOI: 10.31497/zrzyxb.20200107 Cite this Article
    Wu XIAO, Wen-kai ZHANG, Xue-jiao LYU, Xin-jing WANG. Spatio-temporal patterns of ecological capital under different mining intensities in an ecologically fragile mining area in Western China: A case study of Shenfu mining area[J]. Journal of Natural Resources, 2020, 35(1): 68 Copy Citation Text show less
    Location of the study area (Shenfu coal mine with county boundaries)
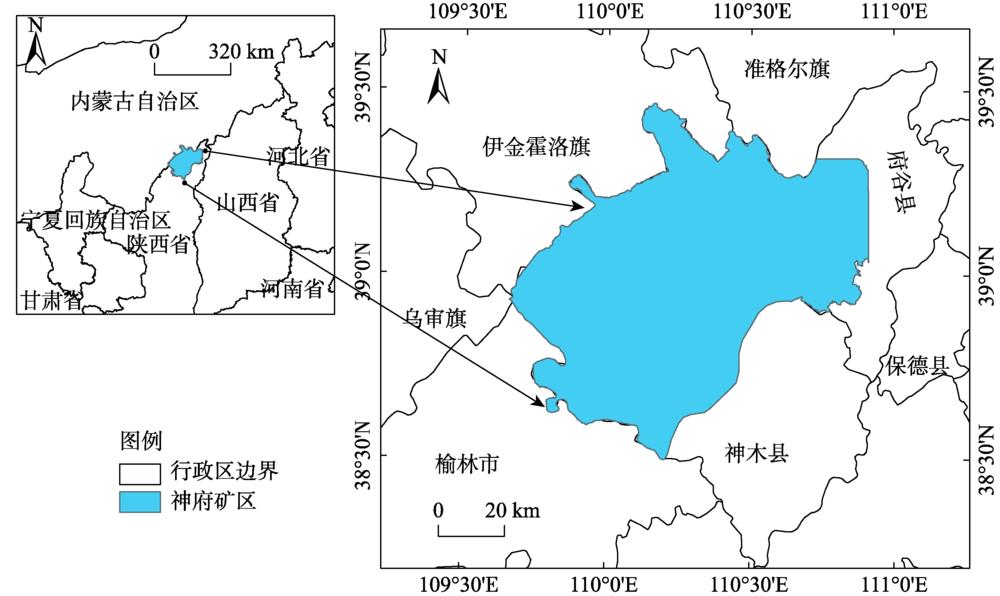
    Fig. 1. Location of the study area (Shenfu coal mine with county boundaries)
    Spatial change of ecosystem service value
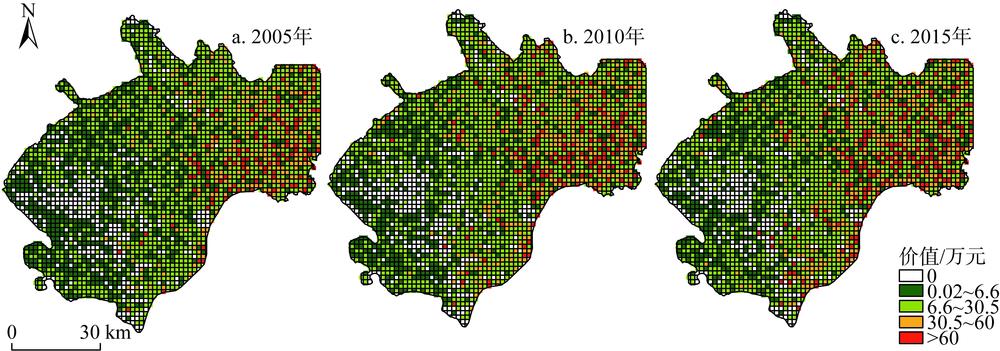
    Fig. 2. Spatial change of ecosystem service value
    Proportions of the area of land use/cover types
    Fig. 3. Proportions of the area of land use/cover types
    Ecosystem service value per unit area of land use types
    Fig. 4. Ecosystem service value per unit area of land use types
    The temporal changes of ecological capital in mining area
    Fig. 5. The temporal changes of ecological capital in mining area
    Zoning of mining intensity zoning
    Fig. 6. Zoning of mining intensity zoning
    Change trends of precipitation and temperature in the study area
    Fig. 7. Change trends of precipitation and temperature in the study area
    采高/m平面开采比/%
    ≥6030~6010~30≤10
    ≥4.50极高
    1.30~4.50
    ≤1.30
    Table 1. Zoning indicator of mining intensity
    年份生态服务功能未开采区低强度开采区中强度开采区高强度开采区极高强度开采区合计
    2005生产有机质1.910.250.290.530.363.34
    释放O23.870.520.591.080.726.77
    固定CO24.390.580.671.220.827.67
    涵养水源13.691.692.054.412.7924.61
    水土保持60.8012.7614.7117.6111.14117.03
    营养物质循环0.260.040.040.070.050.46
    合计84.9215.8418.3324.9215.87159.88
    2010生产有机质2.440.300.360.720.464.28
    释放O24.940.620.731.460.928.67
    固定CO25.610.700.831.651.059.83
    涵养水源14.401.702.104.712.8825.79
    水土保持72.3613.7817.4922.7515.01141.40
    营养物质循环0.330.040.050.100.060.58
    合计100.0917.1421.5631.4020.37190.56
    2015生产有机质2.660.270.360.760.464.52
    释放O25.380.550.731.540.949.15
    固定CO26.100.620.831.751.0610.37
    涵养水源14.291.511.954.542.7125.00
    水土保持86.8715.2419.8425.9015.97163.82
    营养物质循环0.360.040.050.110.060.62
    合计115.6718.2323.7634.6121.21213.48
    2005-2015年变化率/%36.2115.0930.0138.8833.6533.53
    Table 2. Statistics of the ecological capital for five kinds of mining intensity (1010 Yuan)
    Wu XIAO, Wen-kai ZHANG, Xue-jiao LYU, Xin-jing WANG. Spatio-temporal patterns of ecological capital under different mining intensities in an ecologically fragile mining area in Western China: A case study of Shenfu mining area[J]. Journal of Natural Resources, 2020, 35(1): 68
    Download Citation