
Huihui Lu, Zhongmin Wang, Zhijin Huang, Jun Tao, Hanqing Xiong, Wentao Qiu, Heyuan Guan, Huazhuo Dong, Jiangli Dong, Wenguo Zhu, Jianhui Yu, Yongchun Zhong, Yunhan Luo, Jun Zhang, Zhe Chen. Resonance-assisted light–control–light characteristics of SnS2 on a microfiber knot resonator with fast response[J]. Photonics Research, 2018, 6(12): 1137
- Photonics Research
- Vol. 6, Issue 12, 1137 (2018)
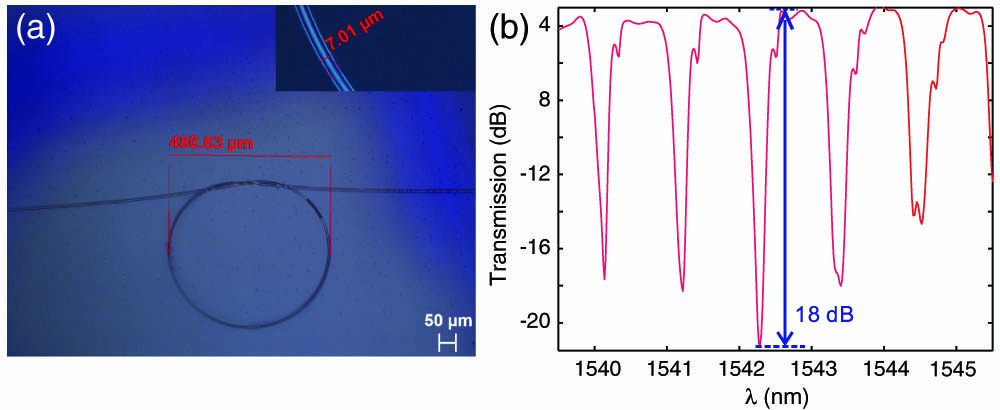
Fig. 1. (a) Microscopic images of the MKR with a loop diameter of D ≈ 480.6 μm d ≈ 7.0 μm ∼ 18.0 dB
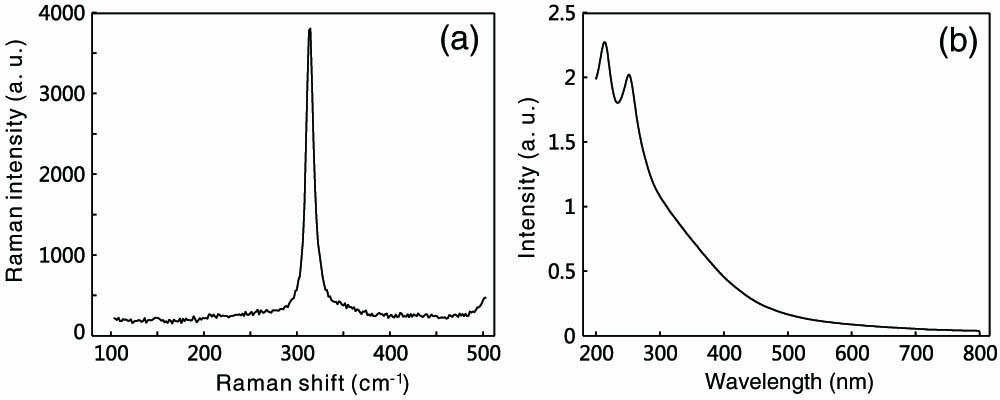
Fig. 2. (a) Raman spectrum of the SnS 2 SnS 2
Fig. 3. (a) Microscopic image of the MKR coated with SnS 2 SnS 2
Fig. 4. Experimental setup for light amplitude tuning by violet pump light power.
Fig. 5. (a) Transmission recorded from the MKR without SnS 2 SnS 2 SnS 2 SnS 2 γ = 0.033 κ r = 0.298 Re ( n eff ) = 1.47
Fig. 6. (a) Measured normalized transmission spectra of the MKR with SnS 2 γ = 0.673 κ r = 0.217 Re ( n eff ) = 1.42
Fig. 7. Transmission spectrum of the MKR with SnS 2
Fig. 8. Linear fit of Δ T λ res = 1533 nm λ res = 1544.7 nm λ res = 1564 nm λ res = 1569.6 nm
Fig. 9. (a) Experimental setup for device response time measurement. (b) Response time of the device at a probe wavelength of 1548 nm with a violet light power of 2.3, 4.4, and 6.3 mW.
|
Table 1. Resonance Properties of Structures in the MKR with and without
|
Table 2. Properties and the Obtained 7
|
Table 3. Performances Comparison of Different Light–Control–Light Structures

Set citation alerts for the article
Please enter your email address
© Copyright 2018-2021 | Chinese Laser Press. All Rights Reserved 沪ICP备15018463号-20