• Photonics Research
  • Vol. 10, Issue 2, 289 (2022)
Dayong Wang1、2, Duoxuan Ma1, Kunlun Li1, Yaya Zhang1, Jie Zhao1、2, Yunxin Wang1、2, and Lu Rong1、2、*
Author Affiliations
  • 1College of Physics and Optoelectronics, Faculty of Science, Beijing University of Technology, Beijing 100124, China
  • 2Beijing Engineering Research Center of Precision Measurement Technology and Instruments, Beijing 100124, China
  • show less
    DOI: 10.1364/PRJ.442388 Cite this Article Set citation alerts
    Dayong Wang, Duoxuan Ma, Kunlun Li, Yaya Zhang, Jie Zhao, Yunxin Wang, Lu Rong. Dynamic full-field refractive index distribution measurements using total internal reflection terahertz digital holography[J]. Photonics Research, 2022, 10(2): 289 Copy Citation Text show less

    Abstract

    Massive usage scenarios prompt the prosperity of terahertz refractive index (THz RI) measurement methods. However, they are very difficult in measuring the full-field dynamical RI distributions of either solid samples without a priori thickness or liquid samples. In this study, we propose total internal reflection THz digital holography and apply it for measuring RI distributions for both solid and liquid samples dynamically. An RI measurement model is established based on an attenuated total reflection prism with a pitching angle. The pitching angle and the field of view can be numerically calculated from the spectrogram of the off-axis Fresnel hologram, which solves the adjustment of the visually opaque prism irradiated by the invisible THz beam. Full-field RI distributions of the droplets of solid-state soy wax and distilled water are obtained and compared with THz time-domain spectroscopy. The evaporation of an ethanol solution droplet is recorded, and the variation of the RI distribution at the sample–prism interface is quantitatively visualized with a temporal resolution of 10 Hz. The proposed method greatly expands the sample range for THz RI measurements and provides unprecedented insight into investigating spontaneous and dynamic THz phenomena.

    1. INTRODUCTION

    Terahertz (THz) radiation, ranging from 0.1 to 10 THz, can easily penetrate diverse non-polarity, non-metallic materials without ionization, but can be strongly absorbed by liquids and other states of water molecules. Various THz spectroscopic and imaging methods have been developed with different configurations to accommodate the properties of THz waves and scenarios. In particular, the approaches of THz refractive index (RI) measurements have been validated in numerous aspects of applications, e.g., non-destructive defect testing of aircraft composite materials from mechanical or heat damage [1], complementary medical diagnosis of melanoma and brain gliomas [2,3], and pigment identification in cultural relic restoration [4].

    THz time-domain spectroscopy (THz-TDS), as the cornerstone of THz imaging and a dominant commercial measurement technique, can measure the sample’s RI curve versus wavelength by Fourier analysis of a complete THz pulse waveform. Two-dimensional (2D) RI distributions are mainly obtained by time-consuming raster scanning. The transmissive configuration is available to collect the mean axial RI distribution of the samples [5], which have low absorption and a priori thickness and require extra preparation, e.g., slicing, dehydration, or paraffin embedding. In comparison, for samples with high absorption and reflectivity or in vivo detection, the reflection geometry is capable of measuring the RI distribution of irradiated surfaces of samples by the Fresnel law [3,6]. Total internal reflection (TIR) THz-TDS is a modality for liquid samples and pressed powder samples; the RI of the sample should be lower than the RI of the attenuated total reflection prism (ATRP). Furthermore, the angle of incidence should be larger than the critical angle of the ATRP [7]. High-resistivity silicon (HRFZ-Si) is commonly used as THz prism material due to its relatively low transmission loss and high RI. The RI distribution at the sample–prism interface can be calculated by measuring the reflection phase variation (RPV) [8]. As a phenomenon of TIR, RPV is decided by the electromagnetic boundary conditions. To enhance the spatial resolution and signal-to-noise ratio (SNR), the sample is commonly illuminated by a focused probe beam without a fixed angle of incidence, which leads to an inaccurate RI calculation. Furthermore, continuous-wave (CW) THz spectrometers based on photomixing can also provide RI curves of solid samples ranging from 60 GHz to 1.8 THz with a spectral resolution of the order of MHz [9]. Compact all-fiber THz frequency-domain spectroscopy is validated to measure the RI curves from 220 to 450 GHz of a semiconductor wafer based on the Fabry–Perot effect [10].

    In addition, THz tomography is available to retrieve the three-dimensional RI distribution of the sample with the assumption of a slow RI change in the sample and its surrounding medium. One category of THz tomography, denoted as THz computed tomography (CT), is based on a geometrical straight-line model of the radiation propagation that neglects the diffraction effects and Fresnel losses [11,12]. The other major category, known as THz diffraction tomography (DT), is based on the weak scattering approximation that accounts for the diffraction effect [1315]. Therefore, the accuracy of RI measurements by THz DT is usually higher than by THz CT, especially for samples with fine structure. The current approaches are very difficult in measuring full-field RI distributions dynamically in the THz band, particularly for liquid samples.

    In the visible-light domain, TIR digital holography (TIR-DH) is proposed to achieve full-field measurements of RI distributions. In the initial configuration, several on-axis holograms are recorded by the interference between the fixed-step phase-shifted reference beam and the TIR beam [16]. It is validated that the changes of the RPV are greater when the prism is irradiated by the p-polarization beam compared to the s-polarization illumination beam [16]. The 2D single-frequency RI distribution is decoupled from the recovered RPV by a two-step phase subtraction method and the Fresnel formula [17]. The reconstruction distance, i.e., the optical path from the bottom plane of the prism to the detector, can be numerically evaluated via autofocusing. However, the phase-shifting configuration is not convenient for dynamic measurement. To enhance the ability of dynamic monitoring, an off-axis Fresnel holographic architecture is proposed based on the Mach–Zehnder interferometer [18] and validated by measuring the RI distribution in the fusion of water and glycerol droplets [17,19]. The object beam and the reference beam propagate along different paths in these configurations, which are affected differently by environmental disturbances. A common-path microscope geometry is presented with an extra slide above the prism [20], which improves the stability of the TIR-DH system. Because the object is illuminated by an inclined parallel beam in TIR-DH, a tilt aberration known as anamorphism is numerically corrected by hologram rescaling and coordinate rotation. Moreover, a hybrid TIR-DH configuration based on a Dove prism is developed, in which an additional transmissive path is integrated so that both the RI and vertical phase distributions can be observed simultaneously [21].

    In the THz domain, with the development of array detectors and CW coherent sources, the variations of visible-light DH, which are categorized as THz DH (TDH), are proliferating in THz lensless full-field phase imaging. In-line TDH achieves sub-wavelength lateral resolution for small-sized objects [22]. However, iterative phase retrieval algorithms are required to suppress the twin image [2325]. Both the size restriction and time-consuming reconstruction in this layout can be relieved by using the transport of intensity equation [26]. The twin image can also be minimized by phase-shifting TDH; nevertheless, the lateral resolution declines because of the extended recording distance for the beam splitter (BS) [27]. Off-axis Fresnel TDH has both transmissive and reflective geometries for different usage scenarios [2832]. Spatial Fourier filtering, autofocusing, angular spectrum integral, and phase unwrapping are adopted in sequence for the numerical reconstruction. The second and third reconstruction steps can be replaced by adopting a single inverse Fourier transform in lensless Fourier-transform TDH. In this triangular interferometric layout, the reference beam is brought to focus at the object plane, and is equidistant from the recording plane. In addition, the environmental disturbances can be suppressed via the common-path self-referencing configuration [33].

    Nevertheless, TDH has not been used for measuring RI distributions nor has TIR-DH been realized in the THz band. The main difficulty for these measurements might be the vertical orientation adjustment of the visually opaque HRFZ-Si ATRP, which is irradiated by the invisible THz beam. The pitching angle of the prism as well as the effective field of view (FOV) is difficult to measure. On the other hand, the current theoretical models in TIR-DH assume that the bottom of the ATRP is parallel to the horizontal plane [1621].

    In this study, we propose the total internal reflection terahertz digital holography (TIR-TDH) and apply it for measuring THz dynamic full-field RI distributions for both solid and liquid samples. A theoretical model is established based on a vertically tilted ATRP irradiated by a p-polarization parallel beam with a fixed angle of incidence. The model not only reveals the relationship of RPV, RI, pitching angle, and other parameters of the prism, but also bypasses the orientation issue of the prism. An experimental setup is built based on a CW 2.52 THz laser, in which off-axis Fresnel holograms are recorded by a pyroelectric array detector. Both the full-field and dynamic abilities of measuring the 2D RI distributions are validated using different types of solid and liquid samples.

    2. REFRACTIVE INDEX MEASUREMENT MODEL

    The principle of TIR-TDH based on a vertically tilted ATRP is illustrated in Fig. 1. To avoid a considerable RI measurement error, the pitching angle of the ATRP is considered in the following deductions.

    Schematic illustration of TIR-TDH when the ATRP is vertically tilted.

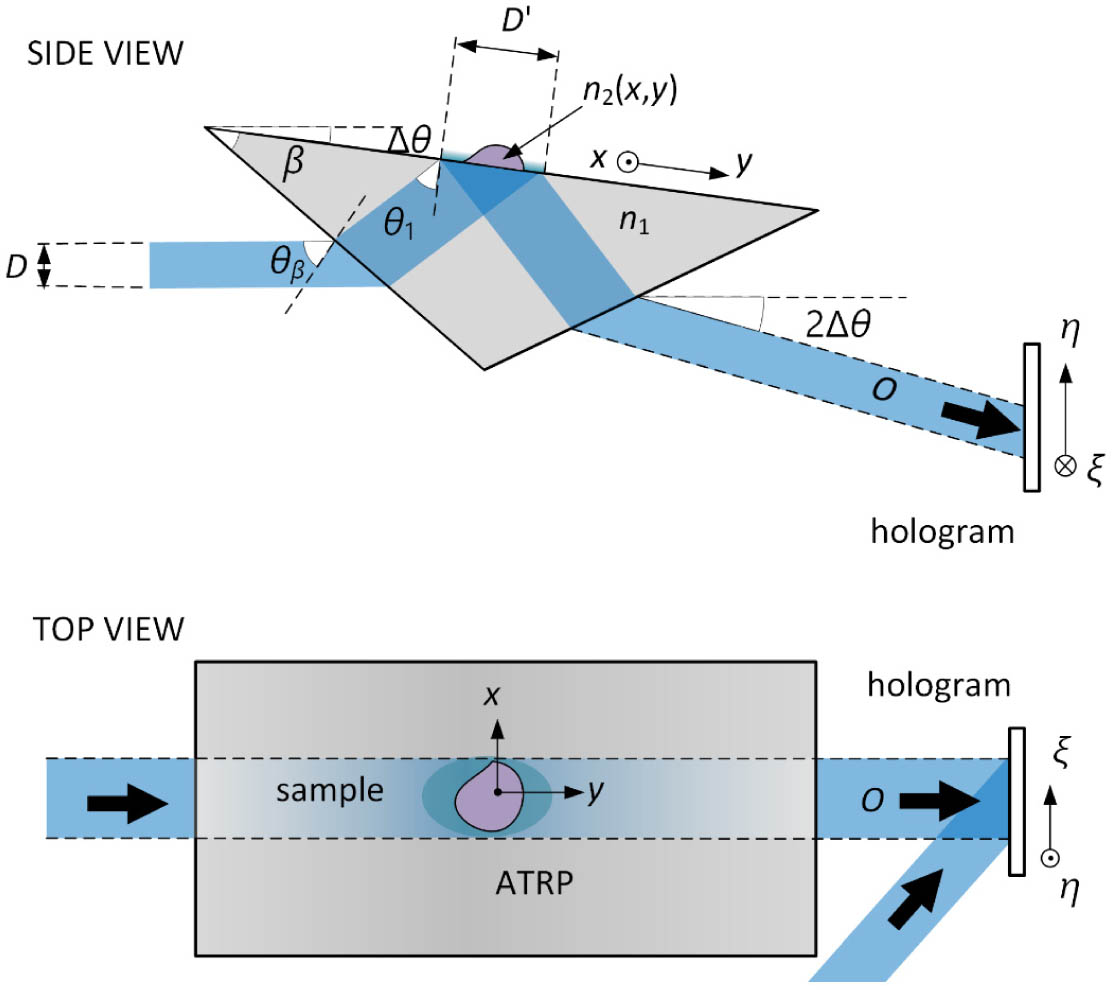
    Figure 1.Schematic illustration of TIR-TDH when the ATRP is vertically tilted.

    It is shown in Fig. 1 that the left side of the ATRP is illuminated by a monochromatic p-polarization parallel wave at a wavelength of λ0. The RI and the base angle of the prism are set to n1 and β, respectively. Assuming the pitching angle of the prism is Δθ, the incident angle is calculated as θβ=90°βΔθ. Thereafter, the incident angle at the bottom plane, which is defined as θ1, can be calculated as θ1=arcsincos(β+Δθ)n1+β.

    When the illumination beam has a circular profile with a diameter of D, the FOV of the imaging system is an elliptical spot with a long axis D and a short axis D, the ratio of which varies with the pitching angle: DD=1(1n1)2cos2(β+Δθ)cos{arcsin[cos(β+Δθ)n1+β]}sin(β+Δθ).

    We assume that x-y is the Cartesian coordinate at the object plane, which is above the adjacent prism’s bottom. The 2D RI distribution at this plane is defined as n2(x,y). There are two prerequisites for TIR at the prism–sample interface: θ1 is larger than the ATRP’s critical angle, θ1>θc=arcsin[n2(x,y)/n1], and the sample thickness d should be considerably larger than the penetration depth of the evanescent field, dλ/2π(n12sin2θ1n22) [34,35]. The beam undergoes TIR at the interface, including a swift wave propagating through the sample along the direction of the interface for some distance, and then goes back to the prism, which is known as the object beam. The RPV φp(x,y) contains the object’s RI information within the FOV [17]: φp(x,y)=2  arctan[n1n12sin2θ1n22(x,y)n22(x,y)cosθ1].

    The emergent beam propagates through the right side of the prism, thereafter interferes with the reference beam, and generates an off-axis Fresnel hologram [36]: Iobj(ξ,η)=|O(ξ,η)+R(ξ,η)|2=|O|2+|R|2+O*R+OR*,where * denotes the complex conjugate, and O and R represent the complex amplitude distributions of the object and reference beams at the recording plane ξη, respectively. R is parallel to the horizontal plane, while O is unparallel; thus, the off-axis angle in the η direction is 2Δθ. This angle can be numerically calculated by measuring the projection length, denoted as qη, between the center of the “+1” term and the center of the “0” term in the vertical axis from the spectrogram of the hologram: Δθ=12arcsinλ0qηNηΔη,where Nη and Δη are the number of pixels and the pixel pitch in the η direction, respectively. It is noted that any pitching angle between 0° and 90° can be measured in this way. The detailed derivation of Eq. (5) is presented in Appendix A, which describes how to get qη and calculate Δθ.

    The hologram is spatially filtered to eliminate the twin image and thereafter is tilt-corrected based on transformation and rescaling of the coordinates to avoid anamorphism [37]. The complex amplitude at the recording plane thereafter propagates backward to the object plane using the angular spectrum integral [36].

    In the experiments, the retrieved phase distribution at the object plane is constituted by the RPV and an additional phase disturbance induced by the experimental setup and the surrounding environment. The phase disturbance can be suppressed via the two-step phase subtraction method [17], assuming the disturbance is invariant during data acquisition. The RPV can be calculated by [17] φp(x,y)=φp(x,y)φbg(x,y)+φair,where φp and φbg denote the RPVs induced by prism–sample and prism–air, corresponding to states with and without the sample inside the FOV, respectively; φair=2×arctan[(n14sin2θ1n12)1/2/cosθ1] is the change in phase difference due to air, which can be calculated from Eq. (3). Therefore, the 2D RI distribution at the interface can be expressed as [17] n2(x,y)n1=12[1+sin22θ1tan2φp(x,y)2]1212cosθ1tanφp(x,y)2.

    3. RESULTS

    A. Experimental Setup

    A schematic diagram of the experimental setup is depicted in Fig. 2. An infrared-pumped laser (295-FIRL-HP, Edinburgh Instruments) emitted a CW THz beam at a wavelength of 118.83 μm (2.52 THz) with a maximum output power of up to 500 mW. The diameter and the divergence angle of the beam were 8  mm and 0.63°, respectively. The polarization state of the beam was turned into p-polarization by an HRFZ-Si (n=3.4175 at 2.52 THz [38]) half-wave plate (HWP). The beam was expanded to 24 mm in diameter using a pair of gold-plated off-axis parabolic mirrors, PM1 and PM2, with effective focal lengths of 50.8 and 152.4 mm, respectively. The beam was partitioned into two portions by an HRFZ-Si BS with a splitting ratio of T54%:R46%. The direction of the reflected beam, i.e., the reference beam, was adjusted by a gold-plated mirror (M), while the transmitted beam was incident on an HRFZ-Si ATRP with a base angle of β=38.4°. Estimated by Eq. (2), the long axis and short axis of the elliptical sample cell, i.e., FOV, were approximately 37 and 24 mm, respectively. The penetration depth of the evanescent field was 27.5  μm. The beam underwent TIR at the sample–prism interface and was emitted from the other side of the prism. The off-axis angle was 20° in the horizontal direction. The off-axis Fresnel holograms were recorded by a pyroelectric detector (Pyrocam IV, Ophir-Spiricon), with a pixel pitch of 80μm×80μm featuring 320×320  pixels. CW THz beams must be chopped to create a changing signal. The pyroelectric detector contains an integrated chopper before the sensor. The chopping frequency was 50 Hz, and the exposure time of every frame was set to 5 ms. To enhance the contrast of the holographic fringes, multiple frames were accumulated for each hologram. The room temperature was stabilized at 16°C during data acquisition.

    Sketch of the actual TIR-TDH system. HWP, half-wave plate; PMs, parabolic mirrors; BS, beam splitter; M, mirror; ATRP, attenuated total reflection prism.

    Figure 2.Sketch of the actual TIR-TDH system. HWP, half-wave plate; PMs, parabolic mirrors; BS, beam splitter; M, mirror; ATRP, attenuated total reflection prism.

    It is noted that alignment is necessary before inserting the ATRP in the layout. According to the deduction listed in Appendix A, when both the illumination beam and the reference beam are parallel with the optical table, the “+1” order, “1” order, and the DC term are at the same horizontal line in the spectrum of the off-axis Fresnel hologram. Otherwise, it could also lead to an angular displacement of the hologram spectrum.

    B. Full-Field Refractive Index Measurement

    To verify the effectiveness of the full-field 2D RI measurements, a solid droplet of soy wax was adopted. This material consists of a mixture of several higher order alkanes and has a lower phase transition curve than paraffin wax. The sample’s RI was 1.495 at 2.52 THz, measured by a transmissive THz-TDS system (TeraPulse 4000, Teraview), in which the melted soy wax was congealed and pressed onto a solid wafer with a thickness of 2.28 mm.

    At the beginning, 500 frames of the background hologram were recorded without the sample, and the accumulated hologram via Gaussian fitting [23] is denoted as Ibg. The soy wax was heated to 50°C and melted, subsequently dropped from a height of 0.5  m above the prism. A top view photo of the droplet is shown in Fig. 3(a). Figure 3(b) shows the synthesized off-axis hologram Iobj with the accumulation of 500 frames. The contrast of holographic fringes is the metric to evaluate the quality of the recorded hologram, which is 0.494 inside the red dotted line box in Fig. 3(b). The Fourier spectrum of the hologram is represented in Fig. 3(c), in which the “+1” order is marked with a white dashed line. It is able to locate the central coordinates of the spectral components by searching for their maximum value points. The distance qη along the vertical axis was 4 pixels. Therefore, the pitching angle Δθ and the incident angle θ1 were 0.53° and 51.76°, respectively. The reconstruction distance was 100 mm, as calculated by the autofocusing algorithm based on the squared gradient. The object wavefront was backward propagated by the angular spectrum integral, followed by the two-step phase subtraction and pixel resizing through biquadratic interpolation. The reconstructed RPV distribution is shown in Fig. 3(d). The 2D RI distribution at the TIR interface was calculated by Eq. (7), as shown in Fig. 3(e). The mean RI of the 50×50  pixels region inside the black dashed line was measured to be 1.499±0.029, which was close to the RI value obtained by the THz-TDS system.

    RI measurement results of a soy wax droplet. (a) Photograph of the sample. (b) Hologram Iobj recorded by TIR-TDH. (c) Spectra of the interpolated hologram. (d) RPV distribution. (e) Corresponding 2D RI distribution.

    Figure 3.RI measurement results of a soy wax droplet. (a) Photograph of the sample. (b) Hologram Iobj recorded by TIR-TDH. (c) Spectra of the interpolated hologram. (d) RPV distribution. (e) Corresponding 2D RI distribution.

    In contrast to transmissive geometries, the TIR-TDH system is also available to measure the 2D RI distribution of liquids. A droplet of distilled water, as shown in Fig. 4(a), was adopted as another sample. The acquisition time of the object hologram was 10  s, during which the influence of evaporation can be ignored. The accumulated hologram, the reconstructed RPV, and RI distributions are shown in Figs. 4(b)–4(d), respectively. It is obvious in Fig. 4(d) that there is a bright ring around the edge of the droplet, where the thickness of the droplet reached the level of the evanescent wave range. Therefore, the RPV distribution indicates a mixture of water and air, resulting in a decreased RI value [39]. There is also a fluctuation in the RPV and RI distributions, similar to the results in the visible-light domain [17,21]. This is mainly due to the nonuniform THz illumination beam, as well as the fluctuation of the irradiation power and the surrounding environment disturbance during data acquisition. The mean RI inside the black dashed line region in Fig. 4(d) was 2.00±0.02, similar to the value of 2.05 at 2.52 THz obtained by the THz-TDS system mentioned above.

    RI measurement results of a distilled water droplet. (a) Photograph of sample. (b) Hologram Iobj recorded by TIR-TDH. (c) RPV distribution. (d) Corresponding 2D RI distribution.

    Figure 4.RI measurement results of a distilled water droplet. (a) Photograph of sample. (b) Hologram Iobj recorded by TIR-TDH. (c) RPV distribution. (d) Corresponding 2D RI distribution.

    C. Dynamic Refractive Index Measurement

    The dynamic RI distribution measurement was also performed to monitor the evaporation process of a droplet constituted by 25% water and 75% ethanol. The RI distribution of the ethanol solution droplet is uniform in the initial state. However, the volatilization rates of ethanol and water are quite different, and the volatilization situations at different surface regions between the droplet and air are not identical, both of which lead to the dynamic diffusion of ethanol inside the droplet. Therefore, the RI distribution at the droplet–prism interface should be anisotropic and dynamic. The RI value is close to that of air in the region where the droplet volatilizes. The remaining droplet is mostly water and has an RI close to that of water. Therefore, a volatile ethanol droplet is an appropriate test sample to validate the feasibility of measuring 2D RI distribution dynamically.

    In this experiment, every 10 successive frames were accumulated to form a hologram without Gaussian fitting, since 10 frames are statistically insufficient to extract the expectancy of the intensity from the Gaussian statistics. The interval of the temporal adjacent holograms was five frames. Therefore, the video rate of the RI distribution measurement was 10 Hz (see Visualization 1). The evaporation process was synchronously recorded by a cell phone (P20, HUAWEI). When dripping down onto the prism, the droplet dispersed rapidly due to its low surface tension. There were no obvious changes in either the 2D profile or RI distribution on the interface side in the first 10 s. Thereafter, the edge of the droplet began to shrink, while the ethanol portion of the solution evaporated much faster than the water, resulting in the RI value of the solution approaching the RI value of water or air in different regions.

    Figures 5(a) and 5(b) illustrate nine photographs with a fixed time interval of 1.5 s and the corresponding RI distributions at 2.52 THz. The area of the droplet decreased by 78% from 10 to 22 s. As the thickness of the droplet became thinner during evaporation, the boundary ring became more obvious. It is illustrated in Fig. 5(b) that a 25×25  pixels brown square was selected from the center of the RI distribution, while a green one with same size close to the edge of the droplet, was chosen. The average RI values of these two regions during the evaporation process are plotted in Fig. 5(c). The mean value is adopted to reduce the influence of random error on measurement accuracy and reflect the trend of RI variation more accurately. The initial RI values in both the green and brown curves are 1.80. The RI value in the brown curve eventually reached 2.07, which was close to the RI value of water. Because of the fast volatilization rate of ethanol in the solution, the brown region might become mostly water eventually. On the other hand, the mean RI began to decrease at 13  s within the green region, which had thinner thickness and was close to the edge of the droplet. It reached 1.0 at 23  s, which was close to the RI value of air. Figure 5(d) illustrates time varied RI data extracted from the white line shown in Fig. 5(b), indicating the process as the droplet shrunk and eventually disappeared. Compared with the curves of mean value, the three-dimensional surface plotted in Fig. 5(d) not only more accurately displays the RI variations of each pixel during the volatilization process, but also more intuitively reflects the downtrend of the droplet area.

    THz RI measurement of an evaporating 75% ethanol droplet. (a) Photographs at different moments. (b) Corresponding 2D RI distributions at 2.52 THz. (c) Changes in the average RI values over time in different regions illustrated in (b). (d) Varied RI data extracted from the white line in (b).

    Figure 5.THz RI measurement of an evaporating 75% ethanol droplet. (a) Photographs at different moments. (b) Corresponding 2D RI distributions at 2.52 THz. (c) Changes in the average RI values over time in different regions illustrated in (b). (d) Varied RI data extracted from the white line in (b).

    4. DISCUSSION AND CONCLUSION

    In summary, we proposed TIR-TDH, which enables dynamic full-field measurement of the 2D RI distribution at the THz band. Previously, it was not possible to measure the dynamic full-field RI distribution of liquid samples in the THz domain, with only some transmissive solid samples of fixed thicknesses that could be measured. The availability of full-field and dynamic RI measurements was experimentally validated by the TIR-TDH system using different solid and liquid samples. The proposed method greatly expands the range of samples and provides unprecedented insight into measuring static and dynamic THz RI distributions. TIR-TDH has diverse potential usage scenarios, e.g., using RI as an indicator to distinguish between cancerous and normal tissues [40], observation of the RI variations of gaseous and liquid turbulence under microscope conditions, or characterizing different phase change materials for manufacturing THz modulators and diffraction optical components.

    In the case of a droplet of distilled water as the sample in our setup, the RI error achieves 0.13%, 0.26%, 1.37%, and 2.85% when the pitching angle is 0.5°, 1°, 5°, and 10°, respectively. In addition, the ratio of D'/D decreases monotonously from 3.4 to 2.0 when the pitching angle changes from 10° to 10°. To achieve high precision of RI measurement, the pitching angle should be considered, either minimized mechanically or compensated for numerically. For the first time, the pitching angle of the prism was included in the deduction of the relationship between the 2D RI distribution at the interface and the RPV irradiated by a p-polarization parallel beam. We constructed a non-contact estimation method of the pitching angle from the Fourier spectrum of the off-axis Fresnel hologram. Any angle from 0° to 90° can be numerically calculated, relieving the restriction of the prism’s vertical orientation. It is noted that this angular offset can also be minimized by aligning the prism precisely. The main difficulty is that the visually opaque HRFZ-Si ATRP is irradiated by the invisible THz beam. Therefore, the alignment still needs assistance by estimating the relative positions of the spectral components of the hologram as mentioned in Eq. (5) and Appendix A. Compared with physical alignment, the numerical estimation method is not only an alternative and much more convenient way for TIR-TDH, but also boosts the speed and precision of the alignment process in other CW THz interferometric geometries. To our knowledge, this concept has not yet been applied in TDH. Considering the invisible THz waves, the effective FOV of the system can be also calculated by Eq. (2) rather than visual observation, which is particularly useful in THz experiments.

    In addition, in the reported THz TIR imaging and RI measurement geometries, the sample was mainly illuminated by a convergent beam. In our configuration, samples are irradiated by a parallel beam with a fixed angle of incidence, thus improving the accuracy of RI measurement. The environmental disturbance can be suppressed by applying the two-step phase subtraction method.

    So far, the interval of temporal adjacent RI distributions is 0.1 s, while the data acquisition speed, i.e., the chopping frequency of the pyroelectric detector, is 50 Hz. The bottleneck of the time resolution is mainly the low SNR of the single frame hologram. This circumstance can be easily improved by using microbolometers instead of pyroelectric detectors. The experimental setup is stable during holographic data acquisition. Nevertheless, its long-term stability is challenged. A bottle of 40 L mixture gas (7% CO2:18% N2:75% He) can last 10  h of continuous operation of 295-FIRL-HP. The shape, position, and output power of the emergent beam usually change after refilling the gas. In addition, approximately every 40 min, the output power of the THz laser as well as the SNR of the THz hologram decreases significantly. Some optical elements of the THz cavity need to be adjusted manually to recover the quality of the laser beam. A selection of more stable CW THz sources, e.g., quantum cascade lasers, would also improve the accuracy and stability of the proposed system. Furthermore, one of the main factors affecting the accuracy is the non-uniform distribution of the THz illumination beam. A THz spatial filter will be a proper solution to improve measurement accuracy [41]. It is noted that the proposed method cannot be used to obtain the RI curve versus wavelength unless a tunable source is adopted. Furthermore, the dynamic changes of RI distribution at the bottom of the droplets with different components and thicknesses will be investigated in the near future. It might be possible to obtain three-dimensional RI distributions of biomedical samples via the scanning of multi-depth sections.

    APPENDIX A: ESTIMATING THE PITCHING ANGLE FROM THE OFF-AXIS HOLOGRAM

    It is shown in Fig. 1 that the incident angle of the object beam is 2Δθ at the recording plane, which is twice the pitching angle of the prism, assuming the incident angle of the reference beam is φ at this plane. The orientation relationship between these two beams is plotted in the coordinates of ξηγ. The optical axis of the object beam is at the ηγ plane, while the optical axis of the reference beam is at the ξγ plane. It is shown in Fig. 6(a) that the azimuth angles of the object and reference beams are (90°, 2Δθ90°, 2Δθ) and (90°φ,90°,φ), respectively. Therefore, the wavefronts of these two beams can be expressed as Oexp{jk[ηsin(2Δθ)+γcos(2Δθ)]},and Rexp[jk(ξsinφ+γcosφ)],where k represents the wavenumber.

    (a) Orientation of the object beam and reference beam in the coordinates of ξ−η−γ. Simulated off-axis Fresnel holograms when the incident angle of the reference beam is 18° and the pitching angle of the prism is (b1) 3° and (b2) −3°. The red arrows indicate the directions of the holographic fringes. (c1), (c2) Corresponding spectra of (b1) and (b2) shown in logarithmic scale.

    Figure 6.(a) Orientation of the object beam and reference beam in the coordinates of ξηγ. Simulated off-axis Fresnel holograms when the incident angle of the reference beam is 18° and the pitching angle of the prism is (b1) 3° and (b2) 3°. The red arrows indicate the directions of the holographic fringes. (c1), (c2) Corresponding spectra of (b1) and (b2) shown in logarithmic scale.

    According to Eq. (4), the holographic fringes appear periodically in the hologram: OR*+O*Rexp{jk[ξsinφηsin(2Δθ)]}+exp{jk[ξsinφ+ηsin(2Δθ)]}2cos[ξksinφ+ηksin(2Δθ)],in which the fringe period w is w=2πksin(2Δθ).

    The spatial frequency in the vertical direction is the reciprocal of the fringe period: fη=sin(2Δθ)/λ, which can also be expressed as fη=qη/(NηΔη), in which (NηΔη)1 is the frequency resolution in the spectral domain [42]. Equation (5) can therefore be obtained.

    It can be deduced from Eq. (5) that the variation of the pitching angle affects the coordinate of the “+1” term in the vertical direction rather than the horizontal direction. It is shown in Figs. 6(b1) and 6(c1) that two simulated off-axis Fresnel holograms consisting of 320×320  pixels with a pitch of 80  μm×80  μm are generated, in which φ=18°,andΔθ=±3°, respectively. The corresponding Fourier spectra of the holograms are represented in Figs. 6(b2) and 6(c2). When the pitching angle is 3°, the fringes are distributed from bottom right to top left in Fig. 6(b1). It is shown in Fig. 6(b2) that the centers of the “+1” term and “1” term are located in the first and third quadrants of the spectrum, respectively, with a vertical interval 2qη=26  pixels. When the pitching angle is 3°, it is illustrated in Figs. 6(c1) and 6(c2) that the direction spectral components are opposite with the case of the positive pitching angle. The vertical interval 2qη is 26  pixels. Therefore, it is possible to derive the pitching angle of the prism from the off-axis angle, which can be calculated from the spectrogram of the hologram.

    References

    [1] C. D. Stoik, M. J. Bohn, J. L. Blackshire. Nondestructive evaluation of aircraft composites using transmissive terahertz time domain spectroscopy. Opt. Express, 16, 17039-17051(2008).

    [2] D. Li, Z. Yang, A. Fu, T. Chen, L. Chen, M. Tang, H. Zhang, N. Mu, S. Wang, G. Liang, H. Wang. Detecting melanoma with a terahertz spectroscopy imaging technique. Spectrochim. Acta A, 234, 118229(2020).

    [3] Y. B. Ji, S. J. Oh, S. Kang, J. Heo, S. Kim, Y. Choi, S. Song, H. Y. Son, S. H. Kim, J. H. Lee, S. J. Haam, Y. M. Huh, J. H. Chang, C. Joo, J. Suh. Terahertz reflectometry imaging for low and high grade gliomas. Sci. Rep., 6, 36040(2016).

    [4] J. B. Jackson, M. Mourou, J. F. Whitaker, I. N. Duling, S. L. Williamson, M. Menu, G. A. Mourou. Terahertz imaging for non-destructive evaluation of mural painting. Opt. Commun., 281, 524-532(2008).

    [5] E. Jung, M. Lim, K. Moon, Y. Do, S. Lee, H. Han, H. J. Choi, K. Cho, K. Kim. Terahertz pulse imaging of micro-metastatic lymph nodes in early-stage cervical cancer patients. J. Opt. Soc. Korea, 15, 155-160(2011).

    [6] S. Fan, E. P. J. Parrott, B. S. Y. Ung, E. Pickwell-MacPherson. Calibration method to improve the accuracy of THz imaging and spectroscopy in reflection geometry. Photon. Res., 4, A29-A35(2016).

    [7] K. Shiraga, Y. Ogawa, T. Suzuki, N. Kondo, A. Irisawa, M. Imamura. Characterization of dielectric responses of human cancer cells in the terahertz region. J. Infrared Millim. Terahertz Waves, 35, 493-502(2014).

    [8] M. Born, E. Wolf. Principles of Optics: Electromagnetic Theory of Propagation, Interference and Diffraction of Light(2013).

    [9] A. Roggenbuck, H. Schmitz, A. Deninger, I. C. Mayorga, J. Hemberger, R. Güsten, M. Grüninger. Coherent broadband continuous-wave terahertz spectroscopy on solid-state samples. New J. Phys., 12, 043017(2010).

    [10] S. Dülme, N. Schrinski, B. Khani, P. Lu, V. Rymanov, A. Stöhr, C. Brenner, M. R. Hofmann. Compact optoelectronic THz frequency domain spectroscopy system for refractive index determination based on Fabry-Perot effect. First International Workshop on Mobile Terahertz Systems (IWMTS), 1-5(2018).

    [11] L. Chen, Y. Wang, D. Xu, Y. Ren, Y. He, C. Li, C. Zhang, L. Tang, C. Yan, J. Yao. Terahertz computed tomography of high-refractive index objects based on refractive index matching. IEEE Photon. J., 10, 5900813(2018).

    [12] D. Wang, R. Ning, G. Li, J. Zhao, Y. Wang, L. Rong. 3D image reconstruction of terahertz computed tomography at sparse angles by total variation minimization. Appl. Opt., 61, B1-B7(2021).

    [13] S. Wang, B. Ferguson, D. Abbott, X. Zhang. T-ray imaging and tomography. J. Biol. Phys., 29, 247-256(2003).

    [14] M. Suga, Y. Sasaki, T. Sasahara, T. Yuasa, C. Otani. THz phase-contrast computed tomography based on Mach-Zehnder interferometer using continuous wave source: proof of the concept. Opt. Express, 21, 25389-25402(2013).

    [15] D. Wang, X. Jin, J. Zhao, Y. Wang, L. Rong, J. J. Healy. Continuous-wave terahertz diffraction tomography for measuring three-dimensional refractive index maps. Chin. Opt. Lett., 19, 123701(2021).

    [16] Z. Jian, P. Hsieh, H. Hsieh, H. Chen, D. Su. A method for measuring two-dimensional refractive index distribution with the total internal reflection of p-polarized light and the phase-shifting interferometry. Opt. Commun., 268, 23-26(2006).

    [17] Y. Zhou, H. Zou, L. Zhong, J. Li, B. Li, J. Tian, X. Lu. Dynamic refractive index distribution measurement of dynamic process by combining dual-channel simultaneous phase-shifting interferometry and total internal reflection. Sci. Rep., 8, 15231(2018).

    [18] W. M. Ash, M. K. Kim. Digital holography of total internal reflection. Opt. Express, 16, 9811-9820(2008).

    [19] J. Zhang, J. Di, Y. Li, T. Xi, J. Zhao. Dynamical measurement of refractive index distribution using digital holographic interferometry based on total internal reflection. Opt. Express, 23, 27328-27334(2015).

    [20] A. Calabuig, M. Matrecano, M. Paturzo, P. Ferraro. Common-path configuration in total internal reflection digital holography microscopy. Opt. Lett., 39, 2471-2474(2014).

    [21] J. Zhang, C. Ma, S. Dai, J. Di, Y. Li, T. Xi, J. Zhao. Transmission and total internal reflection integrated digital holographic microscopy. Opt. Lett., 41, 3844-3847(2016).

    [22] Z. Li, Q. Yan, Y. Qin, W. Kong, G. Li, M. Zou, D. Wang, Z. You, X. Zhou. Sparsity-based continuous wave terahertz lens-free on-chip holography with sub-wavelength resolution. Opt. Express, 27, 702-713(2019).

    [23] L. Rong, T. Latychevskaia, D. Wang, X. Zhou, H. Huang, Z. Li, Y. Wang. Terahertz in-line digital holography of dragonfly hindwing: amplitude and phase reconstruction at enhanced resolution by extrapolation. Opt. Express, 22, 17236-17245(2014).

    [24] L. Rong, T. Latychevskaia, C. Chen, D. Wang, Z. Yu, X. Zhou, Z. Li, H. Huang, Y. Wang, Z. Zhou. Terahertz in-line digital holography of human hepatocellular carcinoma tissue. Sci. Rep., 5, 8445(2015).

    [25] Z. Li, R. Zou, W. Kong, X. Wang, Q. Deng, Q. Yan, Y. Qin, W. Wu, X. Zhou. Terahertz synthetic aperture in-line holography with intensity correction and sparsity autofocusing reconstruction. Photon. Res., 7, 1391-1399(2019).

    [26] L. Rong, S. Wang, D. Wang, F. Tan, Y. Zhang, J. Zhao, Y. Wang. Transport of intensity equation-based terahertz lensless full-field phase imaging. Opt. Lett., 46, 5846-5849(2021).

    [27] M. Yamagiwa, T. Minamikawa, F. Minamiji, T. Mizuno, Y. Tokizane, R. Oe, H. Koresawa, Y. Mizutani, T. Iwata, H. Yamamoto, T. Yasui. Visualization of internal structure and internal stress in visibly opaque objects using full-field phase-shifting terahertz digital holography. Opt. Express, 27, 33854-33868(2019).

    [28] E. Hack, P. Zolliker. Terahertz holography for imaging amplitude and phase objects. Opt. Express, 22, 16079-16086(2014).

    [29] M. Locatelli, M. Ravaro, S. Bartalini, L. Consolino, M. S. Vitiello, R. Cicchi, F. Pavone, P. De Natale. Real-time terahertz digital holography with a quantum cascade laser. Sci. Rep., 5, 13566(2015).

    [30] P. Zolliker, E. Hack. THz holography in reflection using a high resolution microbolometer array. Opt. Express, 23, 10957-10967(2015).

    [31] L. Valzania, P. Zolliker, E. Hack. Topography of hidden objects using THz digital holography with multi-beam interferences. Opt. Express, 25, 11038-11047(2017).

    [32] D. Wang, Y. Zhao, L. Rong, M. Wan, X. Shi, Y. Wang, J. T. Sheridan. Expanding the field-of-view and profile measurement of covered objects in continuous-wave terahertz reflective digital holography. Opt. Eng., 58, 023111(2019).

    [33] D. Wang, Y. Zhang, L. Rong, D. Ma, J. Zhao, Y. Wang. Continuous-wave terahertz self-referencing digital holography based on Fresnel’s mirrors. Opt. Lett., 45, 913-916(2020).

    [34] K. Artmann. Berechnung der Seitenversetzung des totalreflektierten Strahles. Ann. Phys., 437, 87-102(1948).

    [35] H. Wang, Y. Wang, D. Xu, L. Wu, C. Yan, D. Yan, L. Tang, Y. He, H. Feng, J. Yao. High-sensitivity attenuated total internal reflection continuous-wave terahertz imaging. J. Phys. D, 50, 375103(2017).

    [36] J. W. Goodman. Introduction to Fourier Optics(2005).

    [37] Y. Kim, G. Kim, H. Ryu, H. Chu, C. Hwang. Exact light propagation between rotated planes using non-uniform sampling and angular spectrum method. Opt. Commun., 344, 1-6(2015).

    [38] J. Dai, J. Zhang, W. Zhang, D. Grischkowsky. Terahertz time-domain spectroscopy characterization of the far-infrared absorption and index of refraction of high-resistivity, float-zone silicon. J. Opt. Soc. Am. B, 21, 1379-1386(2004).

    [39] P. Yeh. Optical Waves in Layered Media(1988).

    [40] N. Vohra, T. Bowman, K. Bailey, M. El-Shenawee. Terahertz imaging and characterization protocol for freshly excised breast cancer tumors. J. Vis. Exp., 158, e61007(2020).

    [41] Y. Gan, B. Mirzaei, S. van der Poel, J. R. G. Silva, M. Finkel, M. Eggens, M. Ridder, A. Khalatpour, Q. Hu, F. van der Tak, J. Gao. 3.9 THz spatial filter based on a back-to-back Si-lens system. Opt. Express, 28, 32693-32708(2020).

    [42] T.-C. Poon, J.-P. Liu. Introduction to Modern Digital Holography with MATLAB(2014).

    Dayong Wang, Duoxuan Ma, Kunlun Li, Yaya Zhang, Jie Zhao, Yunxin Wang, Lu Rong. Dynamic full-field refractive index distribution measurements using total internal reflection terahertz digital holography[J]. Photonics Research, 2022, 10(2): 289
    Download Citation