• Journal of Geo-information Science
  • Vol. 22, Issue 9, 1753 (2020)
Pengjun ZHAO* and Yushu CAO
Author Affiliations
  • The Centre for Urban Planning and Transport Studies, College of Urban and Environmental Sciences, Peking University, Beijing 100871, China
  • show less
    DOI: 10.12082/dqxxkx.2020.200134 Cite this Article
    Pengjun ZHAO, Yushu CAO. Identifying Metro Trip Purpose using Multi-source Geographic Big Data and Machine Learning Approach[J]. Journal of Geo-information Science, 2020, 22(9): 1753 Copy Citation Text show less
    Spatial distribution of land-use related variables
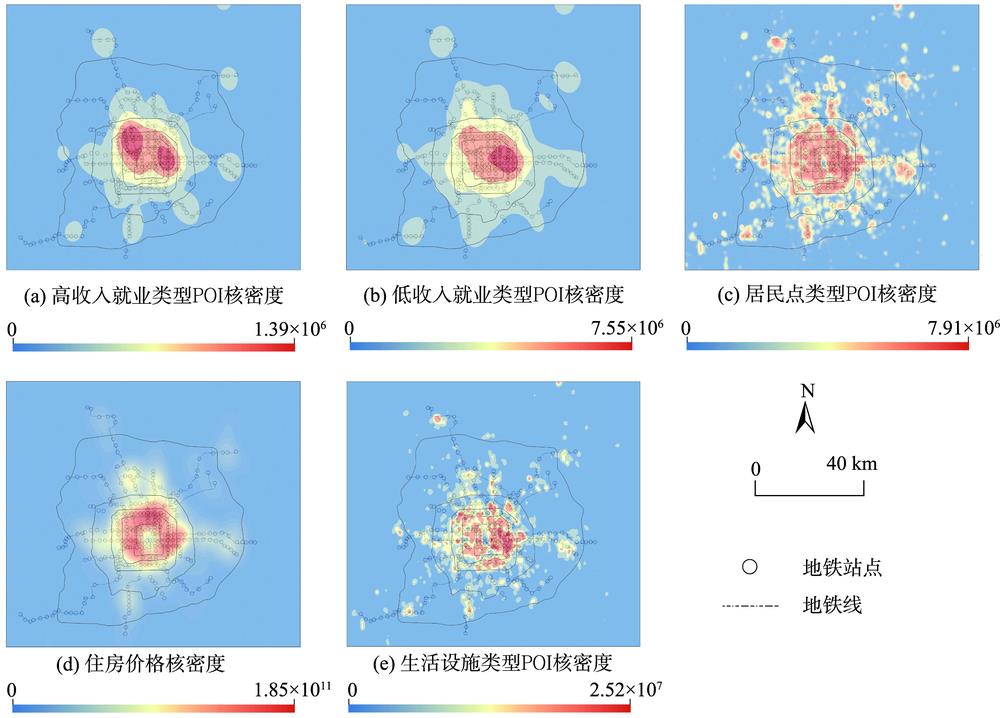
    Fig. 1. Spatial distribution of land-use related variables
    Spatial distribution of metro trip records in a week
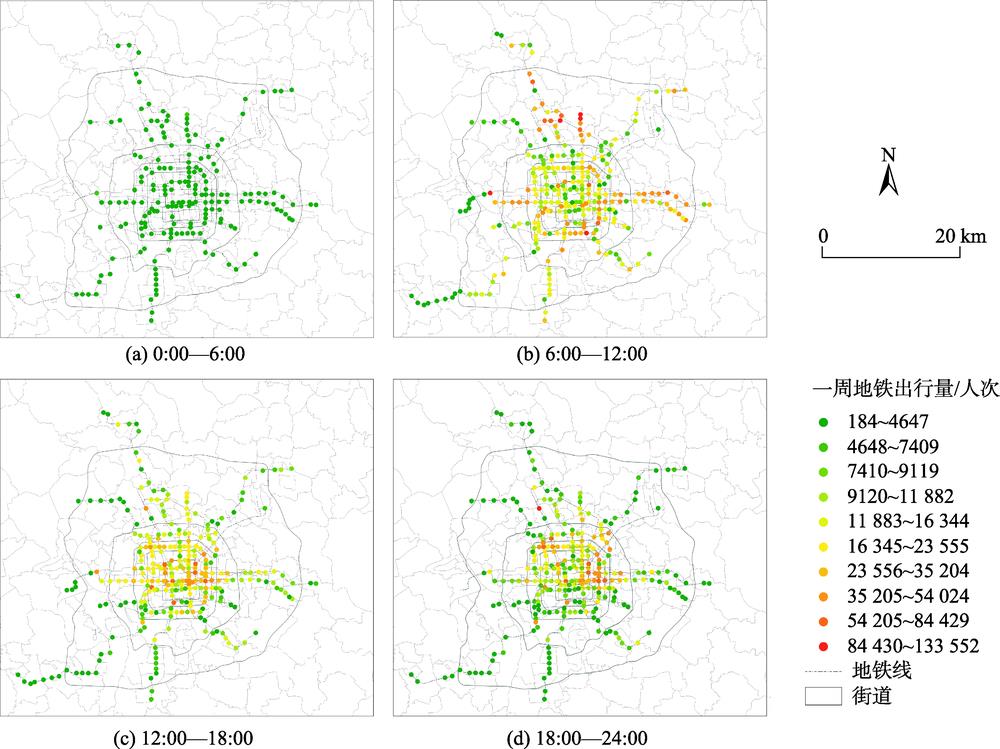
    Fig. 2. Spatial distribution of metro trip records in a week
    Schematic diagram of estimating trip purpose of the smart card transactions
    Fig. 3. Schematic diagram of estimating trip purpose of the smart card transactions
    MDA values of different feature importance in the RF classifier
    Fig. 4. MDA values of different feature importance in the RF classifier
    The OOB accuracy of the RF classifier changes with the number of features
    Fig. 5. The OOB accuracy of the RF classifier changes with the number of features
    Convergence of training of random forest classifiers and judgment of the optimal number of trees
    Fig. 6. Convergence of training of random forest classifiers and judgment of the optimal number of trees
    Temporal distribution of metro trip departures and arrivals for different travel purposes
    Fig. 7. Temporal distribution of metro trip departures and arrivals for different travel purposes
    Spatial distribution of metro trip departures and arrivals for different travel purposes
    Fig. 8. Spatial distribution of metro trip departures and arrivals for different travel purposes
    数据类型数据描述数据年份数据来源
    居民出行调查数据居民一日出行链2015年(对应2014年北京市居民出行情况)北京市交通委员会(http://jtw.beijing.gov.cn/)
    SCD智能卡数据共计约1434万条地铁出行数据2018年(7月1日至7月7日)北京市交通委员会(http://jtw.beijing.gov.cn/)
    百度POI数据用于反映城市服务设施的空间分布情况2015年百度地图开放平台(http://lbsyun.baidu.com/)
    地铁站点数据北京市地铁站点空间分布情况2014年、2018年北京地铁(https://www.bjsubway.com/)
    住房交易价格数据单位面积成交价格2015年北京链家网(https://bj.lianjia.com/)
    Table 1. Data sources and brief description
    出行目的样本数量/条占比/%
    回家327058.76
    其他4988.95
    上班179732.29
    总计5565100.00
    Table 2. Number and proportion of metro trips by purpose intraffic survey data
    特征名称特征描述
    出行目的被识别变量(上班、回家、其他)
    出行特征出发时刻、到达时刻、出行时长
    土地利用特征起止点周边高收入、低收入工作场所类型POI核密度值
    起止点周边居民点类型兴趣点与住房价格核密度值
    起止点周边公共服务与生活服务设施类型POI核密度值
    起止点到市中心欧式距离
    Table 3. Variables included in the random forest classifier
    样本数量/条样本占比/%
    分类结果为“回家”分类结果为“其他”分类结果为“上班”预测准确样本占比
    真实值为“回家”782381493.76
    真实值为“其他”8452359.21
    真实值为“上班”04243991.27
    Table 4. Random forest classifier confusion matrix results
    样本数量/条样本占比/%
    分类结果为“回家”分类结果为“其他”分类结果为“上班”仅包含出行特征分类准确样本占比初始RF分类器准确样本占比
    真实值为“回家”765381593.5293.76
    真实值为“其他”22313336.0559.21
    真实值为“上班”35642887.8991.27
    Table 5. Comparison of confusion matrix betweenrandom forest classifier with or without travel-related variables
    Pengjun ZHAO, Yushu CAO. Identifying Metro Trip Purpose using Multi-source Geographic Big Data and Machine Learning Approach[J]. Journal of Geo-information Science, 2020, 22(9): 1753
    Download Citation