
K. Q. Pan, Z. C. Li, L. Guo, T. Gong, S. W. Li, D. Yang, C. Y. Zheng, B. H. Zhang, X. T. He. Competition among the two-plasmon decay of backscattered light, filamentation of the electron-plasma wave and side stimulated Raman scattering[J]. High Power Laser Science and Engineering, 2023, 11(6): 06000e76
- High Power Laser Science and Engineering
- Vol. 11, Issue 6, 06000e76 (2023)
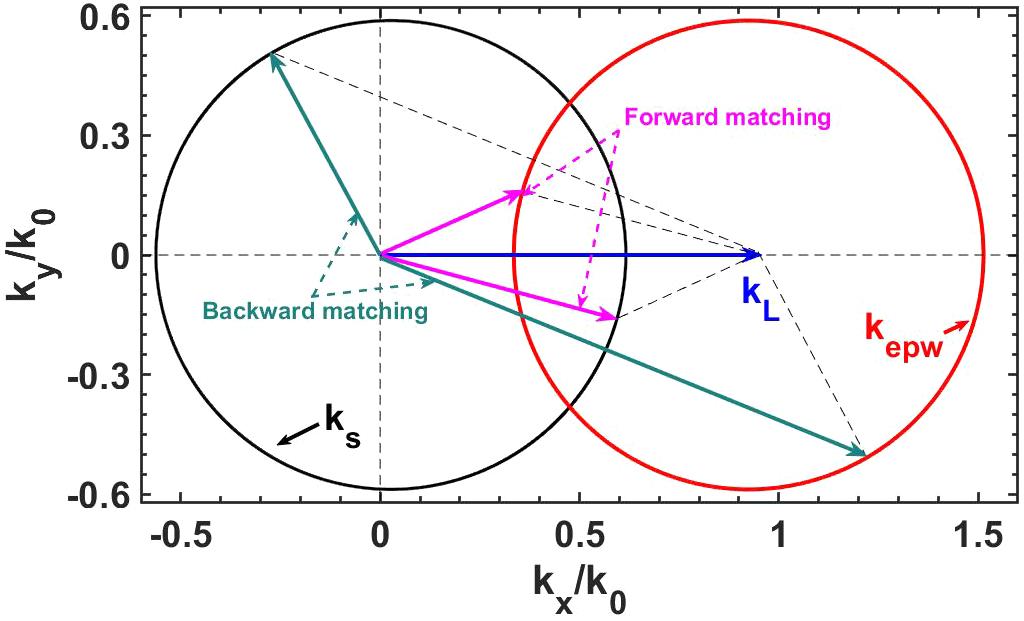
Fig. 1. Calculated wave numbers of the scattered lights and EPWs of SRS for  and
and  keV according to
 Equations (1) –(5). In the figure,  is the laser wave number in vacuum and the laser is propagating in the
  direction. Both the laser and the scattered light have polarization, which means the direction of their electric fields is parallel to
  . When discussing SRS,
  and
and  should be firstly satisfied; two examples are given in this figure, where the magenta is forward SSRS matching and the cyan is backward SSRS matching.
and keV according to is the laser wave number in vacuum and the laser is propagating in the direction. Both the laser and the scattered light have polarization, which means the direction of their electric fields is parallel to . When discussing SRS, and should be firstly satisfied; two examples are given in this figure, where the magenta is forward SSRS matching and the cyan is backward SSRS matching. 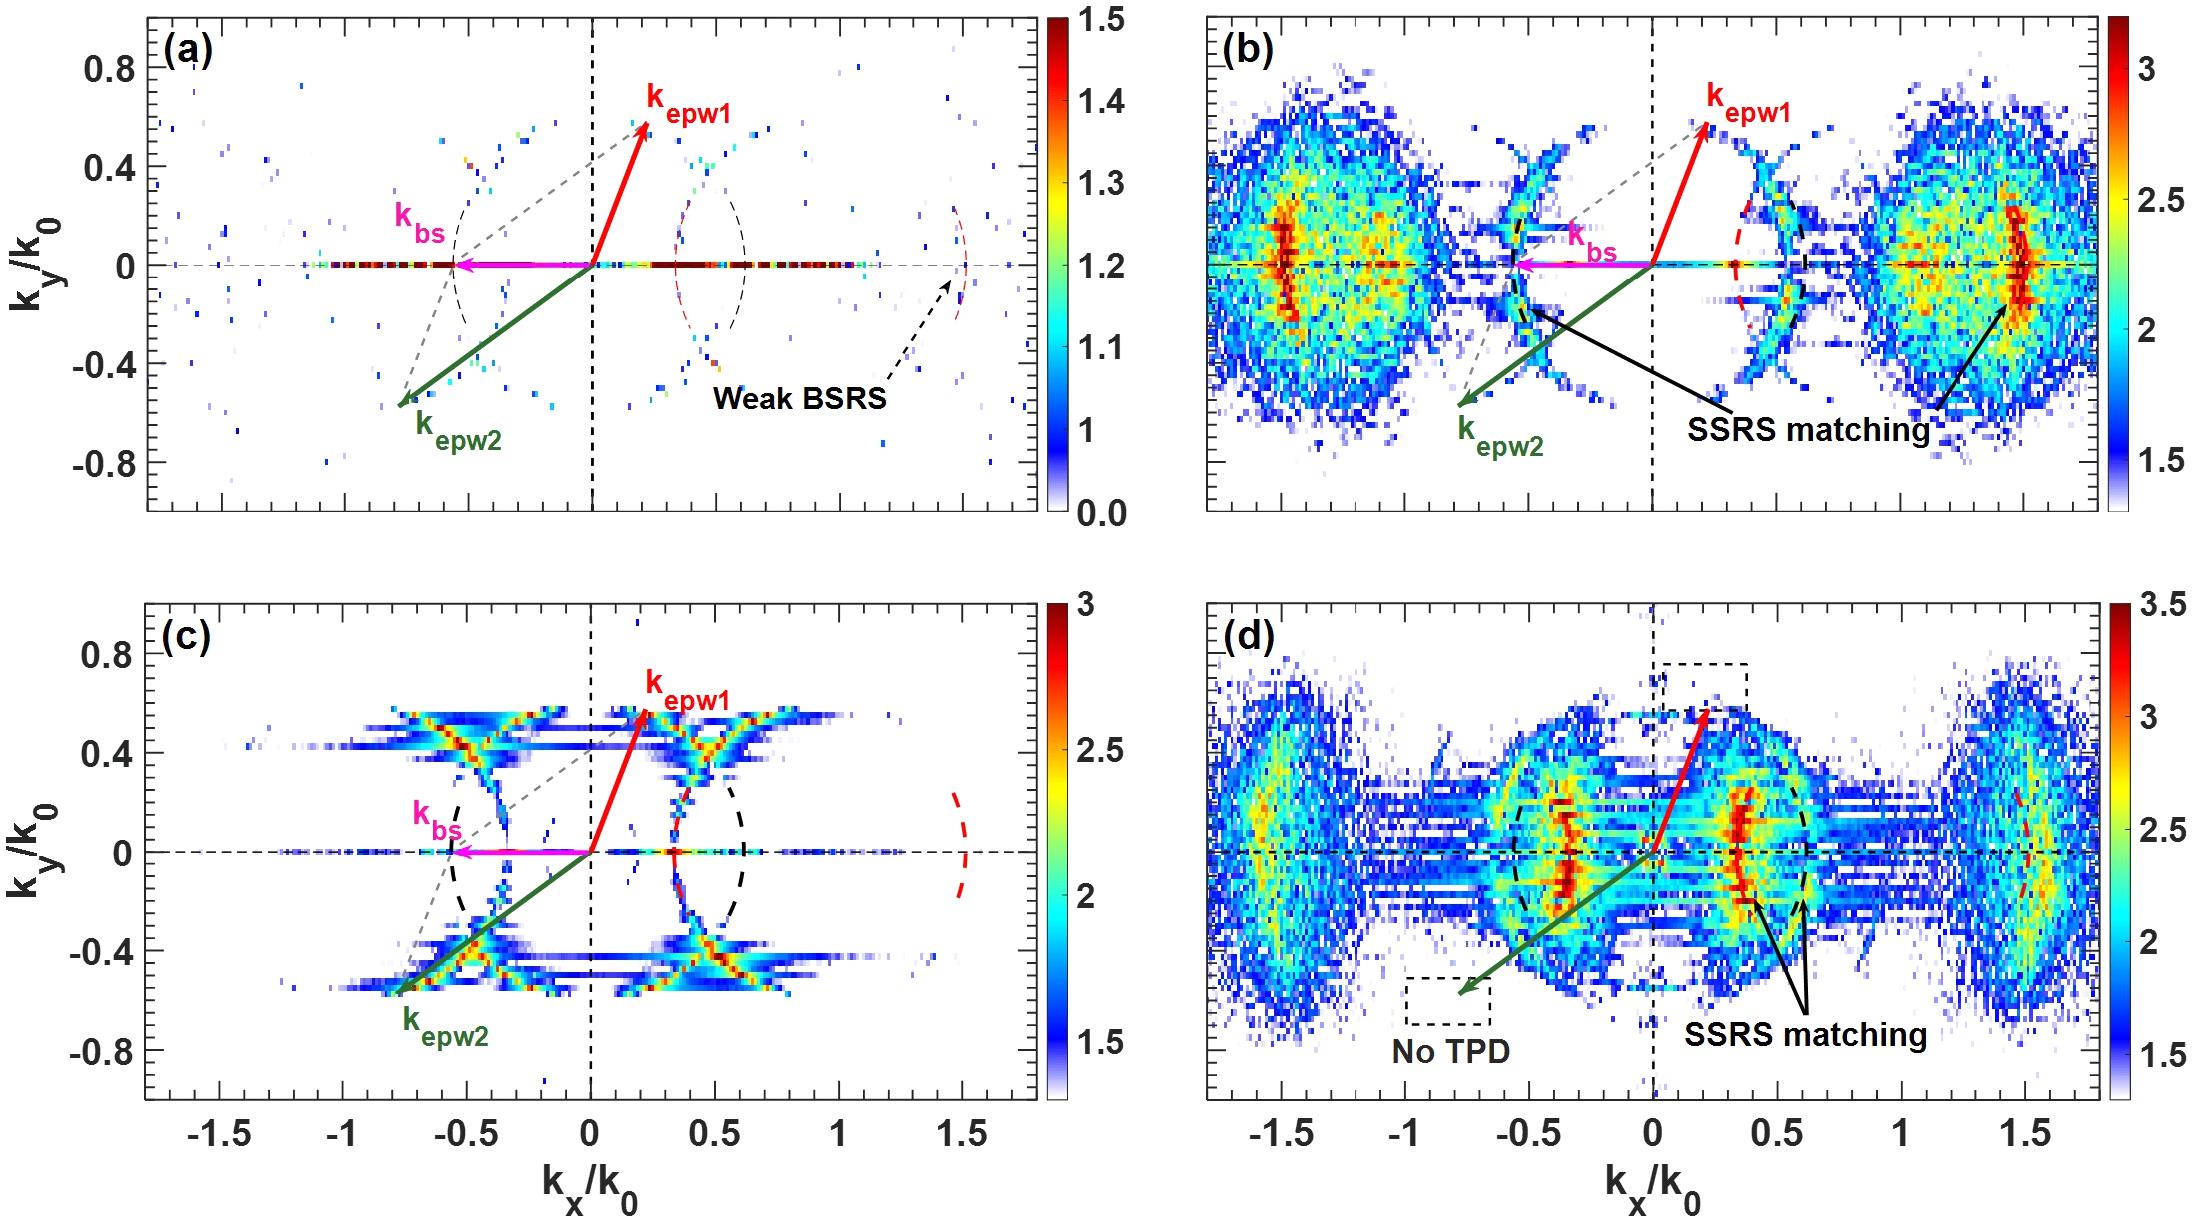
Fig. 2. Snapshots of  in
in k -space for case 1 (a) and case 2 (b) at the early stage ( ). Snapshots of
  in
in k -space for case 1 (c) and case 2 (d) at the latter stage ( ). The intensities of the spectra are in arbitrary units. The arrows denote the excited instabilities and the dashed lines denote the theoretical wave numbers of the EPW (red) and the scattered light (black) shown in
 Figure 1 . It should be mentioned that  has both an EM component and an electrostatic component for side scattering.
in ). Snapshots of in ). The intensities of the spectra are in arbitrary units. The arrows denote the excited instabilities and the dashed lines denote the theoretical wave numbers of the EPW (red) and the scattered light (black) shown in has both an EM component and an electrostatic component for side scattering. Fig. 3. Snapshots of  in
in k -space: (a), (b) cases 1 and 2, respectively, at  ; (c), (d) cases 1 and 2, respectively, at
  . The magenta dashed curve represents the theoretical wave numbers of back scattered or back side scattered light and the red dashed curve represents the theoretical wave numbers of forward scattered or forward side scattered light. In the figure, the intensities of the spectra are in arbitrary units.
in ; (c), (d) cases 1 and 2, respectively, at . The magenta dashed curve represents the theoretical wave numbers of back scattered or back side scattered light and the red dashed curve represents the theoretical wave numbers of forward scattered or forward side scattered light. In the figure, the intensities of the spectra are in arbitrary units. Fig. 4. Snapshots of  in real space,
 k -space and electron density perturbation  in real space. The left column represents the early stage at
  and the right column represents the latter stage at
  . (a), (b)
  in real space, where the value is normalized by
  W/cm2. (c), (d)
  in
in k -space for region I. (e), (f)  in
in k -space for region II. The intensities of the spectra are in arbitrary units. (g), (h)  in real space.
in real space, in real space. The left column represents the early stage at and the right column represents the latter stage at . (a), (b) in real space, where the value is normalized by W/cm2. (c), (d) in in in real space. Fig. 5. Snapshots of the electron distribution functions in x -px space: (a), (b) distribution functions for case 1 in the early and latter stages, respectively; (c), (d) those for case 2 in the early and latter stages, respectively.

Set citation alerts for the article
Please enter your email address
© Copyright 2018-2021 | Chinese Laser Press. All Rights Reserved 沪ICP备15018463号-20