
Xue-Bin Wang, Can Xu, Zhi-Gang Zheng. Synchronization in coupled oscillators with multiplex interactions [J]. Acta Physica Sinica, 2020, 69(17): 170501-1
- Acta Physica Sinica
- Vol. 69, Issue 17, 170501-1 (2020)
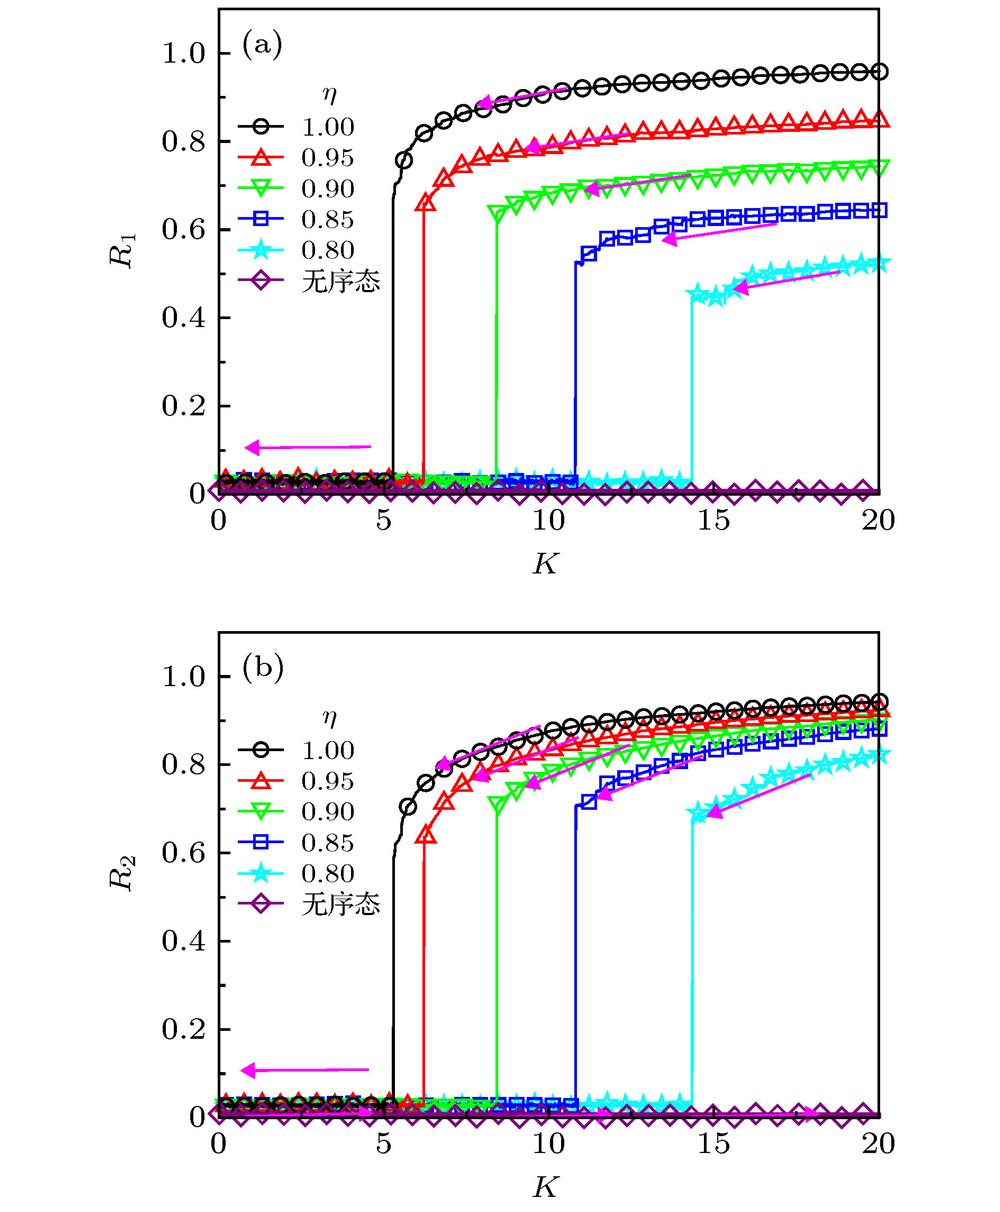
Fig. 1. Relation between the order parameter
 ((a), (b)) and the coupling strength
 K . Arrows denote the direction of the adiabatic change of the coupling K : (a)
 ; (b)
; (b)
 .
.
((a), (b)) and the coupling strength ; (b)
. 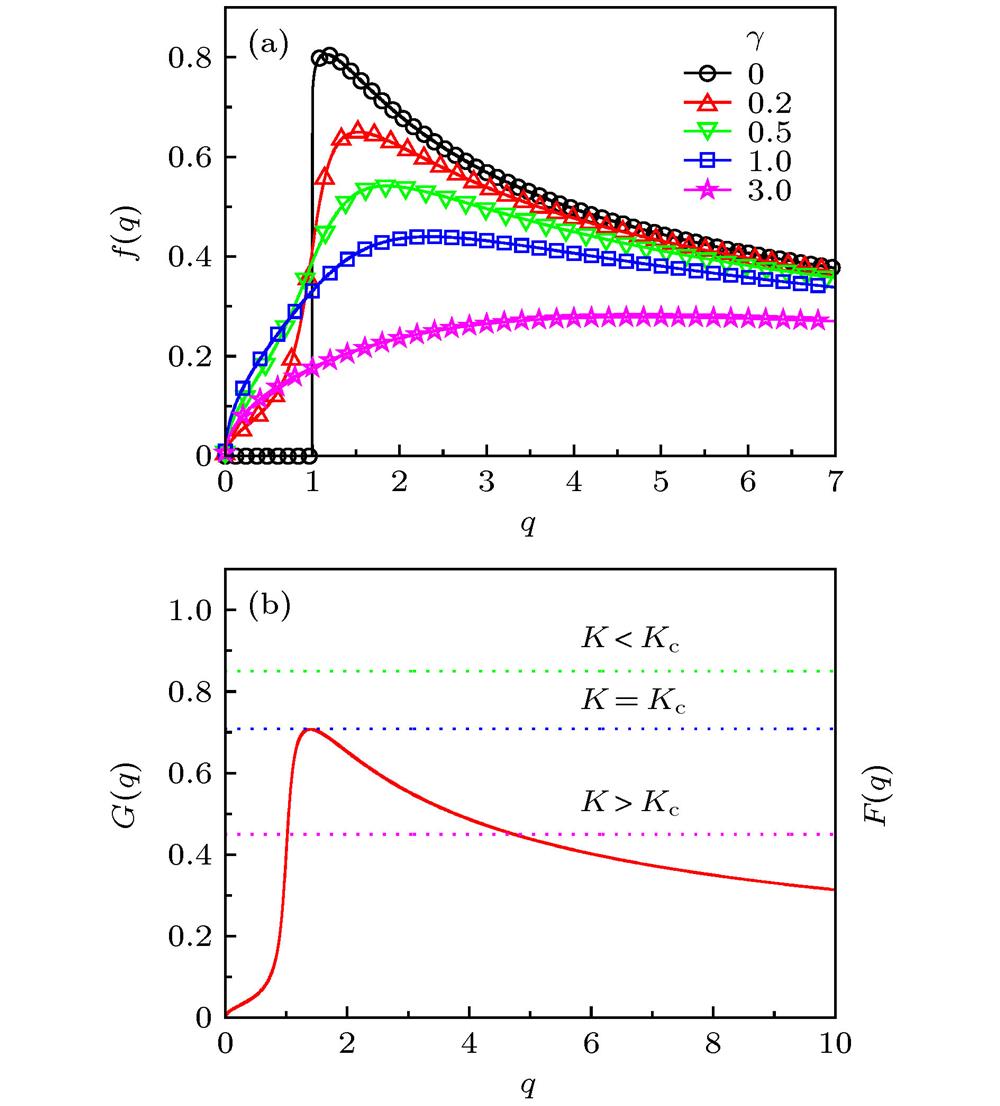
Fig. 2. (a)
 curves when
 ; (b) the intersection of curves
 and
and
 for different couplings
 K , where
 ,
,
 ,
,
 .
.
curves when
; (b) the intersection of curves
and
for different couplings ,
,
. Fig. 3. The order parameters
 [(a)—(c)] and
 [(d)—(f)] varying against the coupling strength
 K for different γ and
 , when the natural frequency obeys a bimodal Lorentz distribution: (a), (d)
 ; (b), (e)
 ; (c), (f)
 . Theoretical predictions and numerical results are labeled as solid lines and symbols, respectively (
 ). For every
 η , the initial phase is set as 0 and π for η and 1–η .
[(a)—(c)] and
[(d)—(f)] varying against the coupling strength , when the natural frequency obeys a bimodal Lorentz distribution: (a), (d)
; (b), (e)
; (c), (f)
. Theoretical predictions and numerical results are labeled as solid lines and symbols, respectively (
). For every Fig. 4. Oscillatory behaviors of the order parameter
 for different coupling strengths
 K , where
 ,
,
 ,
,
 , and
, and
 : (a), (b)
 ; (c), (d)
 .
.
for different coupling strengths ,
,
, and
: (a), (b)
; (c), (d)
. Fig. 5.  curves where 2
m is the number of peaks of the distribution function for
 .
.
curves where 2. Fig. 6. The order parameters
 [(a), (c)] and
 [(b), (d)] varying against the coupling strength
 K for different m and
 : (a), (b)
 ; (c), (d)
 . Theoretical predictions and numerical results are labeled as solid lines and symbols, respectively. The dotted lines are the theoretical predictions of the critical values of ADT given in (
40 ).
[(a), (c)] and
[(b), (d)] varying against the coupling strength : (a), (b)
; (c), (d)
. Theoretical predictions and numerical results are labeled as solid lines and symbols, respectively. The dotted lines are the theoretical predictions of the critical values of ADT given in (
Set citation alerts for the article
Please enter your email address
© Copyright 2018-2021 | Chinese Laser Press. All Rights Reserved 沪ICP备15018463号-20