• High Power Laser Science and Engineering
  • Vol. 9, Issue 4, 04000e51 (2021)
S. Bettoni1, A. Cavalieri1、2, A. Dax1, E. Divall1, C. P. Hauri3, S. Hunziker4, M. Huppert1, M. Kaiser1, M. Paraliev1, C. Sydlo1, C. Vicario1, and A. Trisorio1、*
Author Affiliations
  • 1Paul Scherrer Institut, 5232Villigen, Switzerland
  • 2University of Bern, 3012Bern, Switzerland
  • 3TRUMPF Switzerland, 7214Grusch, Switzerland
  • 4HUBER+SUHNER AG, 9100Herisau, Switzerland
  • show less
    DOI: 10.1017/hpl.2021.36 Cite this Article Set citation alerts
    S. Bettoni, A. Cavalieri, A. Dax, E. Divall, C. P. Hauri, S. Hunziker, M. Huppert, M. Kaiser, M. Paraliev, C. Sydlo, C. Vicario, A. Trisorio. Overview of SwissFEL dual-photocathode laser capabilities and perspectives for exotic FEL modes[J]. High Power Laser Science and Engineering, 2021, 9(4): 04000e51 Copy Citation Text show less
    Functional layout of one of the two SwissFEL PCDLs including the photocathode drive UV pulse, the laser heater (LH), and the short probe (SP) pulse.
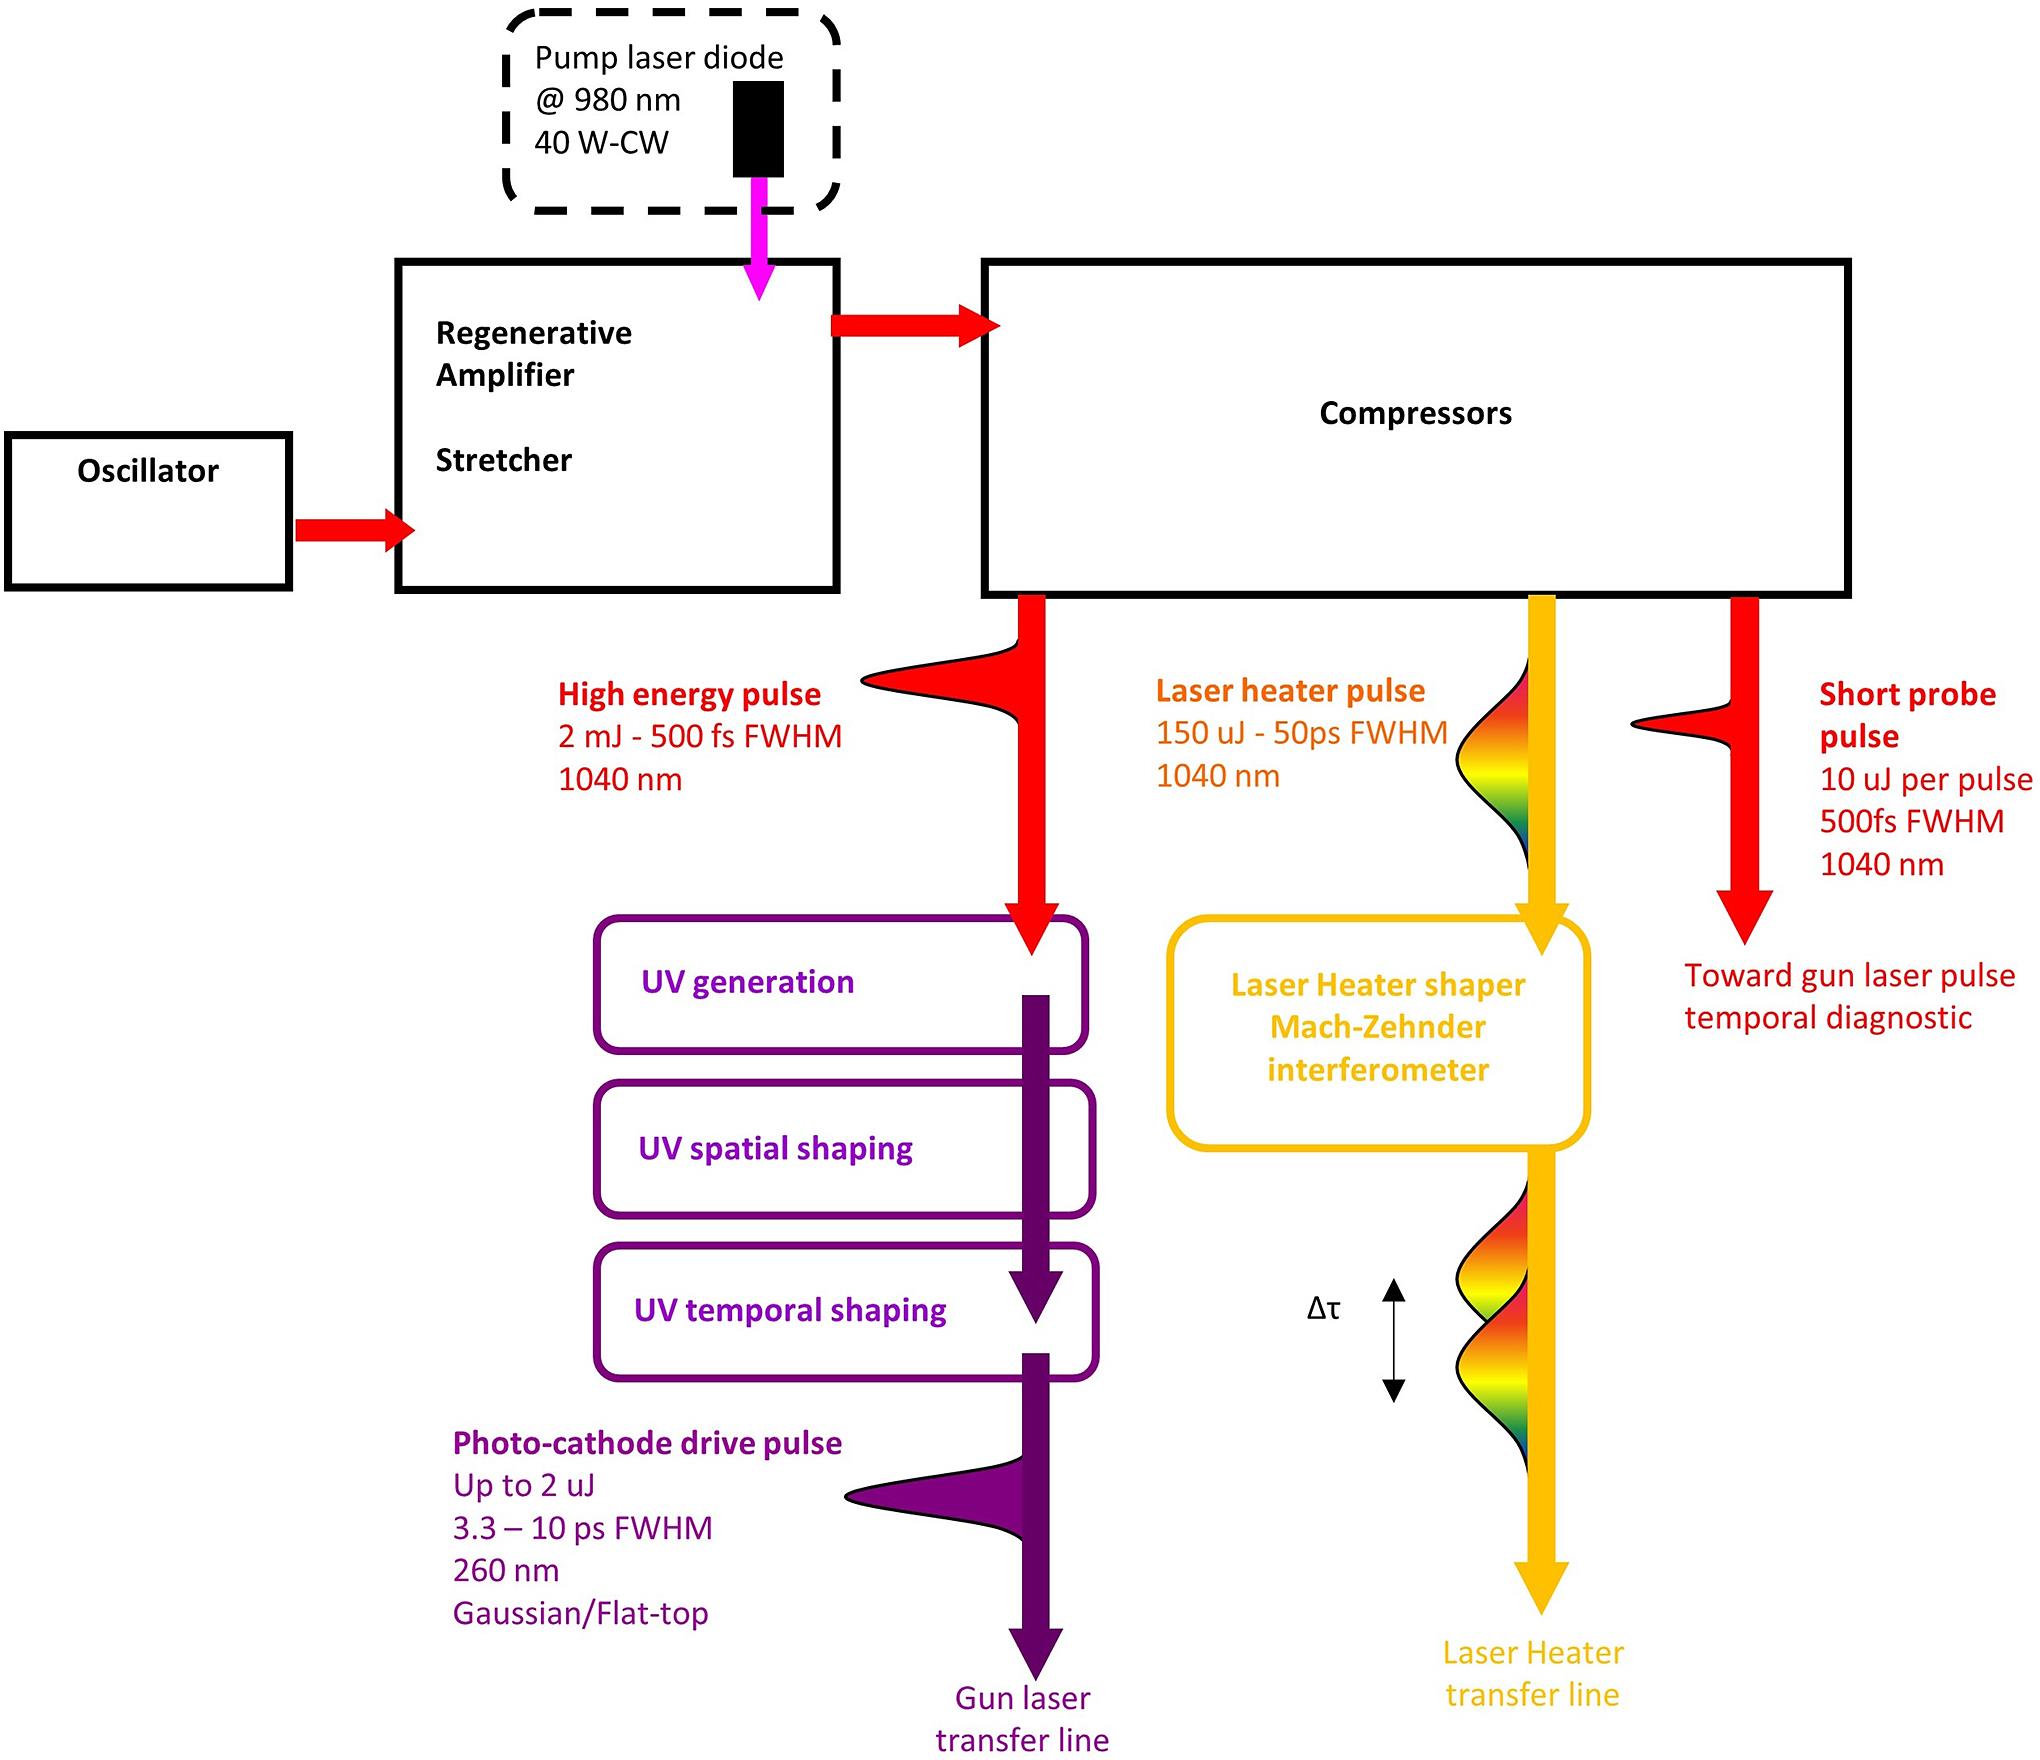
    Fig. 1. Functional layout of one of the two SwissFEL PCDLs including the photocathode drive UV pulse, the laser heater (LH), and the short probe (SP) pulse.
    Optical setup for the characterization of the Origami-10 oscillator. F1 and F2, SM980 fiber outputs 1 and 2 with SC/APC connector; BS, beam splitter; P, Thorlabs S144C sensor + PM100 controller; A, APE Pulse Check autocorrelator; S, Ocean Optics Maya2000Pro-NIR spectrometer; C, Wincam UV-CCD.
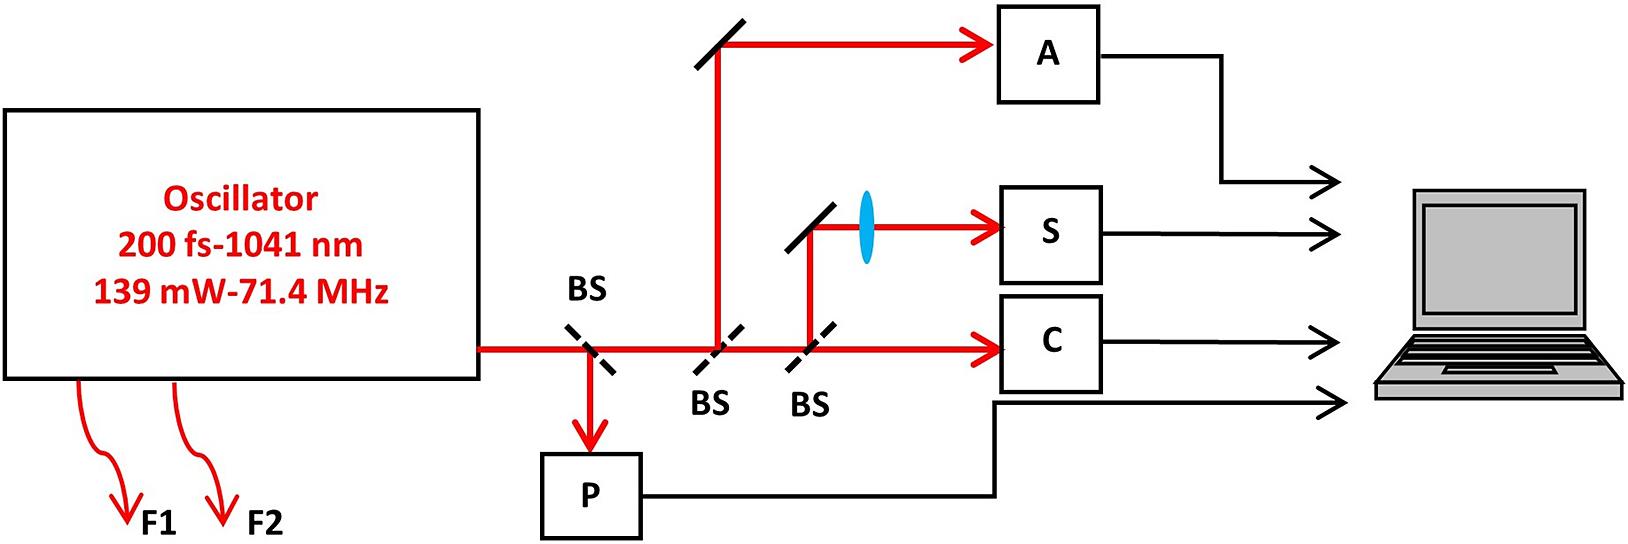
    Fig. 2. Optical setup for the characterization of the Origami-10 oscillator. F1 and F2, SM980 fiber outputs 1 and 2 with SC/APC connector; BS, beam splitter; P, Thorlabs S144C sensor + PM100 controller; A, APE Pulse Check autocorrelator; S, Ocean Optics Maya2000Pro-NIR spectrometer; C, Wincam UV-CCD.
    (a) Deconvolved autocorrelation measurement of the oscillator pulse. (b) Measured spectral intensity.
    Fig. 3. (a) Deconvolved autocorrelation measurement of the oscillator pulse. (b) Measured spectral intensity.
    Beam profile of the oscillator output. As expected, the beam profile exiting from the oscillator is symmetric and has no intensity hotspot.
    Fig. 4. Beam profile of the oscillator output. As expected, the beam profile exiting from the oscillator is symmetric and has no intensity hotspot.
    Oscillator output power versus time. The long-term amplitude stability is 1.07% peak–peak and 0.18% r.m.s. over 12 hours.
    Fig. 5. Oscillator output power versus time. The long-term amplitude stability is 1.07% peak–peak and 0.18% r.m.s. over 12 hours.
    Measurement setup used for the free-running and locked timing jitter. BP Filter, 2.9988 GHz bandpass filter; LN Ampl., low-noise amplifier; PLL, phase-locked loop; SSA, signal source analyzer.
    Fig. 6. Measurement setup used for the free-running and locked timing jitter. BP Filter, 2.9988 GHz bandpass filter; LN Ampl., low-noise amplifier; PLL, phase-locked loop; SSA, signal source analyzer.
    On the left axis is the measured absolute phase noise (in dBc/Hz) for the RF reference signal (green), the free-running (blue), and the locked (orange) Origami-10 laser oscillator. Measurements were performed using a Holzworth HA7062C SSA. The SSA carrier frequency was 2.9988 GHz and the number of correlations for obtaining one trace was set to 100. On the right axis is the integrated jitter for the reference signal, the free-running, and the locked laser oscillator. The numerical value of cumulated timing jitter (right to left) after each decade is indicated as well.
    Fig. 7. On the left axis is the measured absolute phase noise (in dBc/Hz) for the RF reference signal (green), the free-running (blue), and the locked (orange) Origami-10 laser oscillator. Measurements were performed using a Holzworth HA7062C SSA. The SSA carrier frequency was 2.9988 GHz and the number of correlations for obtaining one trace was set to 100. On the right axis is the integrated jitter for the reference signal, the free-running, and the locked laser oscillator. The numerical value of cumulated timing jitter (right to left) after each decade is indicated as well.
    Absorption spectrum of Yb:CaF2 at RT (black). The absorption peak around 980 nm (yellow window) allows direct pumping with CW diodes[22" target="_self" style="display: inline;">22].
    Fig. 8. Absorption spectrum of Yb:CaF2 at RT (black). The absorption peak around 980 nm (yellow window) allows direct pumping with CW diodes[22].
    Layout of one of the PCDL systems, the various optical elements are packaged in sealed boxes. The overall footprint is 1.5 m × 2.5 m. BS, beam splitter; Diag, diagnostics module boxes that include Joule meter, camera, and optical fiber for spectrum acquisition.
    Fig. 9. Layout of one of the PCDL systems, the various optical elements are packaged in sealed boxes. The overall footprint is 1.5 m × 2.5 m. BS, beam splitter; Diag, diagnostics module boxes that include Joule meter, camera, and optical fiber for spectrum acquisition.
    Autocorrelation trace (black) and Gaussian fit (red) of the amplifier's IR compressed pulse. The pulse duration is 500 fs FWHM.
    Fig. 10. Autocorrelation trace (black) and Gaussian fit (red) of the amplifier's IR compressed pulse. The pulse duration is 500 fs FWHM.
    Measured energy and stability of the high-energy output: system exhibits a very high stability of 0.19% r.m.s. over 1 hour.
    Fig. 11. Measured energy and stability of the high-energy output: system exhibits a very high stability of 0.19% r.m.s. over 1 hour.
    Measured beam profile of the high-energy IR output.
    Fig. 12. Measured beam profile of the high-energy IR output.
    3D CAD layout of the SwissFEL dual-photocathode drive laser (PCDL) optical setup. The PCDLs 1 and 2 (red areas) are capable of delivering the temporally and spatially shaped, deep-UV pulses (blue areas and green area) as well as the laser heater (LH) and the short probe (SP) pulses for the two free electron laser (FEL) lines. The two UV-PCDLs and the two LH beams are recombined (green area) and sent towards the accelerator via two dedicated imaging transfer lines (TLs). The yellow area includes the LH Herriott cell used to delay the two LH pulses.
    Fig. 13. 3D CAD layout of the SwissFEL dual-photocathode drive laser (PCDL) optical setup. The PCDLs 1 and 2 (red areas) are capable of delivering the temporally and spatially shaped, deep-UV pulses (blue areas and green area) as well as the laser heater (LH) and the short probe (SP) pulses for the two free electron laser (FEL) lines. The two UV-PCDLs and the two LH beams are recombined (green area) and sent towards the accelerator via two dedicated imaging transfer lines (TLs). The yellow area includes the LH Herriott cell used to delay the two LH pulses.
    Measured energy and stability of the UV output: system exhibits a very high stability of 0.24% r.m.s. over 200 seconds.
    Fig. 14. Measured energy and stability of the UV output: system exhibits a very high stability of 0.24% r.m.s. over 200 seconds.
    Measured beam profile of the UV output.
    Fig. 15. Measured beam profile of the UV output.
    UV Fourier filtering using a glass capillary. The beam is then collimated and apertured in order to obtain a flat-top spatial intensity profile. This profile is then imaged onto the cathode plane by a two-lens imaging transfer line.
    Fig. 16. UV Fourier filtering using a glass capillary. The beam is then collimated and apertured in order to obtain a flat-top spatial intensity profile. This profile is then imaged onto the cathode plane by a two-lens imaging transfer line.
    PCDL UV beam profile (a) after the Fourier filtering, (b) at the circular aperture, and (c) in the cathode plane.
    Fig. 17. PCDL UV beam profile (a) after the Fourier filtering, (b) at the circular aperture, and (c) in the cathode plane.
    (a) Temporal profile measurement and (b) pulse duration with respect to the stretcher’s gratings spacing for the UV PCDL pulse. The stretcher is used in a double-pass configuration.
    Fig. 18. (a) Temporal profile measurement and (b) pulse duration with respect to the stretcher’s gratings spacing for the UV PCDL pulse. The stretcher is used in a double-pass configuration.
    (a) Principle of operation of the pulse stacking technique and (b) measured flat-top-like PCDL pulse temporal profile using an optical cross-correlator.
    Fig. 19. (a) Principle of operation of the pulse stacking technique and (b) measured flat-top-like PCDL pulse temporal profile using an optical cross-correlator.
    Arrival time drift of the amplifier’s output pulse relative to the oscillator pulse without active feedback measured over 48 hours (blue). For correlation purpose, the laboratory air pressure (black), humidity (green), and temperature (orange) have also been recorded simultaneously. One can see the direct correlation between laser arrival time drift and air pressure.
    Fig. 20. Arrival time drift of the amplifier’s output pulse relative to the oscillator pulse without active feedback measured over 48 hours (blue). For correlation purpose, the laboratory air pressure (black), humidity (green), and temperature (orange) have also been recorded simultaneously. One can see the direct correlation between laser arrival time drift and air pressure.
    Single-shot PCDL 1 (red) and PCDL 2 (blue) timing jitter over 12 hours. The measurement was done using our balanced optical correlator (BOC). The measured time jitter is 4.5 fs r.m.s. over 12 hours.
    Fig. 21. Single-shot PCDL 1 (red) and PCDL 2 (blue) timing jitter over 12 hours. The measurement was done using our balanced optical correlator (BOC). The measured time jitter is 4.5 fs r.m.s. over 12 hours.
    Optical setup of the LH shaping scheme.
    Fig. 22. Optical setup of the LH shaping scheme.
    Recorded interference spectra for various delays between the two replicas.
    Fig. 23. Recorded interference spectra for various delays between the two replicas.
    Streaked TDS image of the 200 pC, flat-top electron bunch (a) before and (b) after BBO crystals angle optimization, and (c) projected temporal profile before (black) and after (blue) optimization.
    Fig. 24. Streaked TDS image of the 200 pC, flat-top electron bunch (a) before and (b) after BBO crystals angle optimization, and (c) projected temporal profile before (black) and after (blue) optimization.
    Charge of bunch 1 (black) and bunch 2 (blue) over 3500 s in dual-bunch operation mode.
    Fig. 25. Charge of bunch 1 (black) and bunch 2 (blue) over 3500 s in dual-bunch operation mode.
    Top: Longitudinal phase space of the bunch core measured at the injector spectrometer. The TDC streaks proportionally the position of the bunch along the vertical direction. The dipole spreads the electrons along the horizontal axis proportionally to their energy. Bottom: Corresponding bunch energy profile. The compression factor is seven.
    Fig. 26. Top: Longitudinal phase space of the bunch core measured at the injector spectrometer. The TDC streaks proportionally the position of the bunch along the vertical direction. The dipole spreads the electrons along the horizontal axis proportionally to their energy. Bottom: Corresponding bunch energy profile. The compression factor is seven.
    Top: Longitudinal phase space of the bunch core measured at the injector spectrometer. The TDC streaks proportionally the position of the bunch along the vertical direction. The dipole spreads the electrons along the horizontal axis proportionally to their energy. Bottom: Corresponding bunch energy profile with LH active (red) as a comparison with the profile without LH (blue). The compression factor is seven.
    Fig. 27. Top: Longitudinal phase space of the bunch core measured at the injector spectrometer. The TDC streaks proportionally the position of the bunch along the vertical direction. The dipole spreads the electrons along the horizontal axis proportionally to their energy. Bottom: Corresponding bunch energy profile with LH active (red) as a comparison with the profile without LH (blue). The compression factor is seven.
    Induced energy spread on the bunch core measured at the injector spectrometer as a function of the LH laser energy.
    Fig. 28. Induced energy spread on the bunch core measured at the injector spectrometer as a function of the LH laser energy.
    Comparison of the horizontal transverse size along the bunch measured at the injector spectrometer. The natural size is removed according to Equation (2) for the case corresponding to the LH laser engaged (LH on) and turned off (LH off).
    Fig. 29. Comparison of the horizontal transverse size along the bunch measured at the injector spectrometer. The natural size is removed according to Equation (2) for the case corresponding to the LH laser engaged (LH on) and turned off (LH off).
    (a) Two-color FEL scheme. A short deep-UV laser is overlapped to the nominal PC laser spoiling locally the emittance. The emittance spoil is preserved during the electron acceleration and in the undulators, and this leads to a two-color FEL mode. (b) Two symmetric color FEL spectra recorded over 6000 consecutive shots. The gray area indicates the statistical scattering recorded over 6000 consecutive spectra.
    Fig. 30. (a) Two-color FEL scheme. A short deep-UV laser is overlapped to the nominal PC laser spoiling locally the emittance. The emittance spoil is preserved during the electron acceleration and in the undulators, and this leads to a two-color FEL mode. (b) Two symmetric color FEL spectra recorded over 6000 consecutive shots. The gray area indicates the statistical scattering recorded over 6000 consecutive spectra.
    Laser parameter at the photocathodeTypical values
    Laser wavelength260 nm
    Repetition rate100 Hz
    Dual bunch separation28 ns
    Pulse duration3.3–10 ps FWHM
    Temporal intensity profileGaussian/flat-top
    Pulse energy5–130 nJ
    Beam diameter0.2–0.7 mm
    Spatial intensity profile on the cathodeFlat-top
    Energy stability on the cathode<0.8% r.m.s.
    Pointing stability relative to the beam diameter<1% r.m.s.
    Temporal jitter with respect to RF<37 fs r.m.s.
    Table 1. SwissFEL UV-photocathode drive laser pulse parameters.
    ManufacturerIbsen Photonics
    Blaze wavelength260 nm
    Lines3846 mm-1
    Angle of incidence30°
    Nominal efficiency per pass in the −1st order>85%
    SubstrateUV-grade fused silica
    Table 2. UV gratings specifications.
    Laser heater parametersTypical values
    Laser wavelength1040 nm
    Dual bunch separation28 ns
    Laser pulse energy per bunchup to 150 μJ
    Laser pulse duration50 ps FWHM
    Table 3. SwissFEL laser heater parameters.
    S. Bettoni, A. Cavalieri, A. Dax, E. Divall, C. P. Hauri, S. Hunziker, M. Huppert, M. Kaiser, M. Paraliev, C. Sydlo, C. Vicario, A. Trisorio. Overview of SwissFEL dual-photocathode laser capabilities and perspectives for exotic FEL modes[J]. High Power Laser Science and Engineering, 2021, 9(4): 04000e51
    Download Citation