• Chinese Journal of Lasers
  • Vol. 49, Issue 3, 0306003 (2022)
Peihua Yu, Zhengxuan Li*, Yan Xu, and Yingxiong Song
Author Affiliations
  • Key Laboratory of Specialty Fiber and Optical Access Networks, School of Communication and Information Engineering, Shanghai University, Shanghai 200444, China
  • show less
    DOI: 10.3788/CJL202249.0306003 Cite this Article Set citation alerts
    Peihua Yu, Zhengxuan Li, Yan Xu, Yingxiong Song. Simulation Analysis of SRS Crosstalk in Super-PON System[J]. Chinese Journal of Lasers, 2022, 49(3): 0306003 Copy Citation Text show less
    Schematic of experimental setup for measuring threshold optical power of SBS
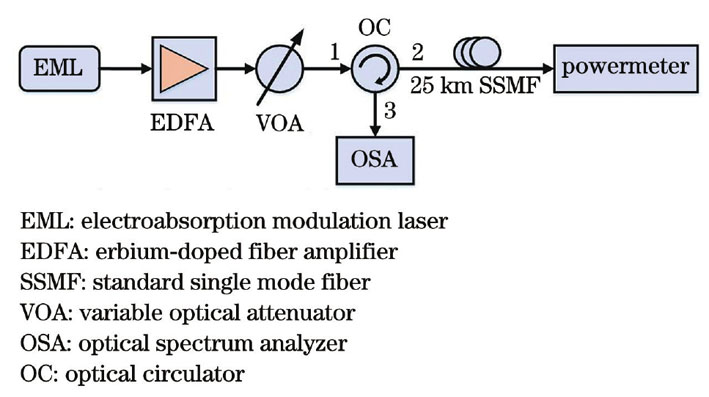
    Fig. 1. Schematic of experimental setup for measuring threshold optical power of SBS
    Measured threshold optical power of SBS after 25 km SSMF transmission. (a) Relationship between output and input powers; (b) reverse transmission spectra under different input optical powers
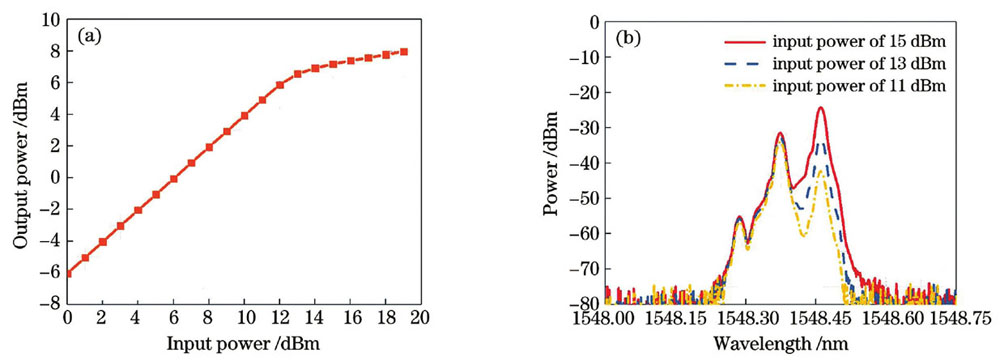
    Fig. 2. Measured threshold optical power of SBS after 25 km SSMF transmission. (a) Relationship between output and input powers; (b) reverse transmission spectra under different input optical powers
    Structural diagram of simulation of Super-PON US and DS
    Fig. 3. Structural diagram of simulation of Super-PON US and DS
    Wavelength assignment of Super-PON, EPON and 10G-EPON systems
    Fig. 4. Wavelength assignment of Super-PON, EPON and 10G-EPON systems
    Power losses of signal for C-band as US and L-band as DS. (a) Under different DS optical powers; (b) under DS optical power of 13 dBm and US optical power of 4 dBm
    Fig. 5. Power losses of signal for C-band as US and L-band as DS. (a) Under different DS optical powers; (b) under DS optical power of 13 dBm and US optical power of 4 dBm
    Power losses of signal for C-band as DS and L-band as US. (a) Under different US input powers;(b) under DS optical power of 13 dBm and US optical power of 10 dBm
    Fig. 6. Power losses of signal for C-band as DS and L-band as US. (a) Under different US input powers;(b) under DS optical power of 13 dBm and US optical power of 10 dBm
    Relationship between BER and received optical power. (a) Ch-16 of DS; (b) Ch-1 of US
    Fig. 7. Relationship between BER and received optical power. (a) Ch-16 of DS; (b) Ch-1 of US
    Power losses of signal under different PON combinations. (a) Super-PON US and 10G-EPON DS; (b) Super-PON US and EPON US
    Fig. 8. Power losses of signal under different PON combinations. (a) Super-PON US and 10G-EPON DS; (b) Super-PON US and EPON US
    Power losses of signal under different PON combinations. (a) Super-PON DS and EPON US; (b) Super-PON DS and 10G-EPON DS
    Fig. 9. Power losses of signal under different PON combinations. (a) Super-PON DS and EPON US; (b) Super-PON DS and 10G-EPON DS
    ParameterContent
    Wavelength /nm1548.378
    Modulation formatNRZ
    Data rate /( Gbit·s-1)25
    Fiber length /km25
    Launched power /dBm019
    Table 1. Experimental parameters
    ChannelL-bandC-band
    Frequency /THzWavelength /nmFrequency /THzWavelength /nm
    1187.6131597.93192.0001561.42
    2187.7111597.10192.1001560.61
    3187.8091596.27192.2001559.79
    4187.9061595.44192.3001558.98
    5188.0041594.61192.4001558.17
    6188.1021593.78192.5001557.36
    7188.2001592.95192.6001556.56
    8188.2971592.12192.7001555.75
    9188.3951591.30192.8001554.94
    10188.4931590.47192.9001554.13
    11188.5901589.65193.0001553.33
    12188.6881588.83193.1001552.52
    13188.7861588.00193.2001551.72
    14188.8831587.18193.3001550.92
    15188.9811586.36193.4001550.12
    16189.0791585.54193.5001549.32
    Table 2. Wavelength assignment of FSR Set 1
    Peihua Yu, Zhengxuan Li, Yan Xu, Yingxiong Song. Simulation Analysis of SRS Crosstalk in Super-PON System[J]. Chinese Journal of Lasers, 2022, 49(3): 0306003
    Download Citation