
Yifan HAO, Yi JIAN. Multi-focus Fusion Method Based on Multi-Scale Local Weighted Variance[J]. Acta Photonica Sinica, 2021, 50(12): 1210001
- Acta Photonica Sinica
- Vol. 50, Issue 12, 1210001 (2021)
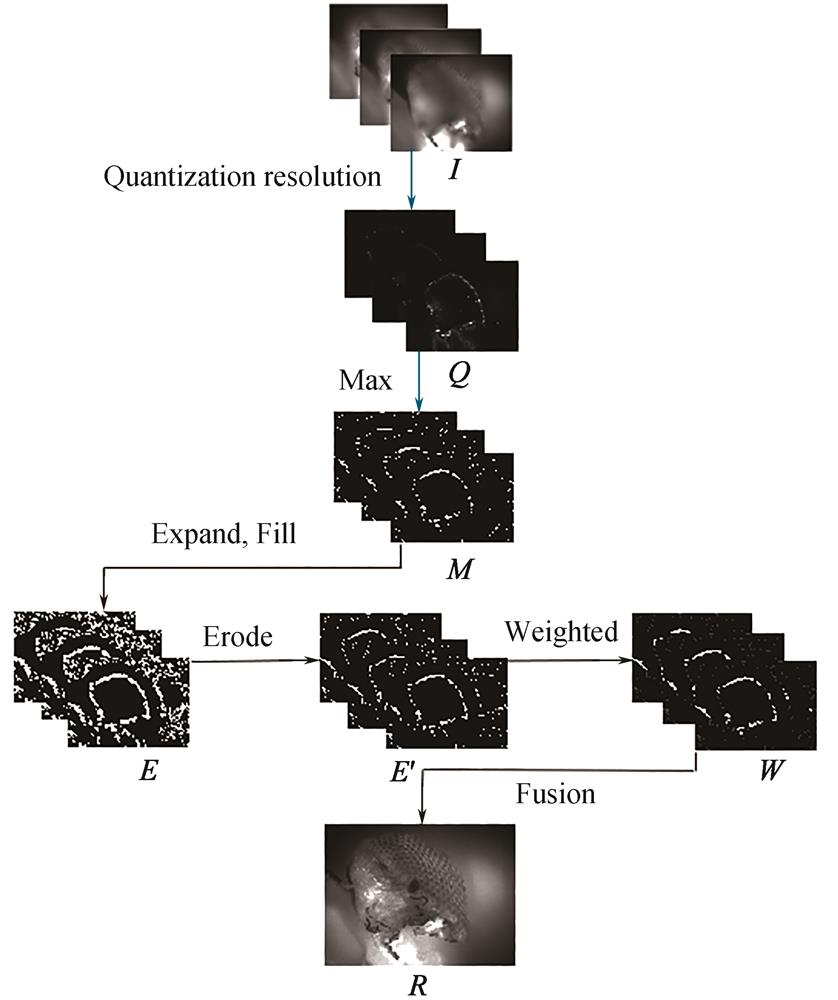
Fig. 1. Flowchart of multi-focus fusion
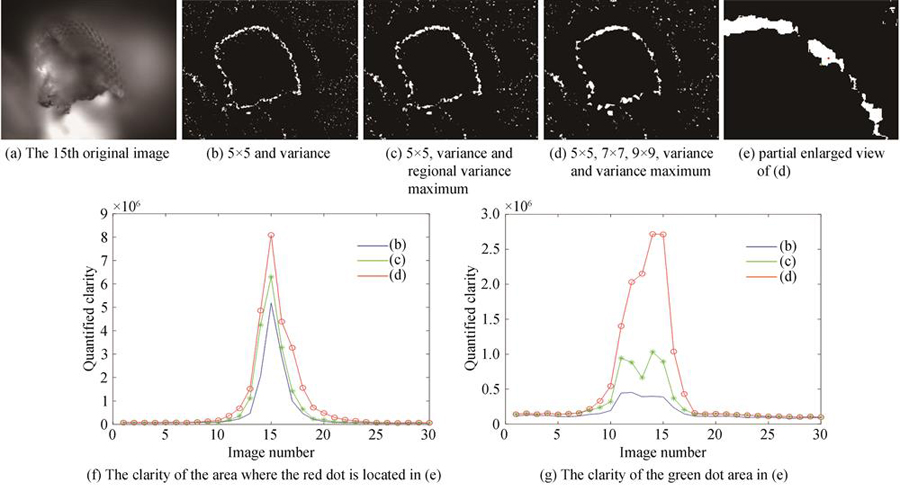
Fig. 2. The output of the intermediate result of the original image quantization definition (there are 30 original images corresponding to the data)
Fig. 3. The influence of mask morphology corrosion factor size to the final result
Fig. 4. Intermediate result of the refined mask
Fig. 5. The result R of multi-focus fusion
Fig. 6. Part of the original image
Fig. 7. Multi focus fusion results of three experiments
Fig. 8. Partial enlarged view of Fig. 7(a)~(d)
Fig. 9. Quality score line chart
|
Table 1. Information entropy(EN) of the fusion results of each algorithm
|
Table 2. Peak signal-to-noise ratio(PSNR) of the fusion results of each algorithm
|
Table 3. Structural similarity index measure(SSIM) of the fusion results of each algorithm
|
Table 4. Cross entropy(CE) of the fusion results of each algorithm
|
Table 5. Perceptual saliency (PS) of the fusion results of each algorithm

Set citation alerts for the article
Please enter your email address
© Copyright 2018-2021 | Chinese Laser Press. All Rights Reserved 沪ICP备15018463号-20