• Advanced Photonics
  • Vol. 5, Issue 5, 056002 (2023)
Lang Li1、2、3, Yingchi Guo1、2、3, Zhichao Zhang1、2、3, Zijun Shang1、2、3, Chen Li1、2、3, Jiaqi Wang1、2、3, Liliang Gao1、2、3, Lan Hai1、2、3, Chunqing Gao1、2、3, and Shiyao Fu1、2、3、*
Author Affiliations
  • 1Beijing Institute of Technology, School of Optics and Photonics, Beijing, China
  • 2Ministry of Education of the People’s Republic of China, Key Laboratory of Photoelectronic Imaging Technology and System, Beijing, China
  • 3Ministry of Industry and Information Technology of the People’s Republic of China, Key Laboratory of Information Photonics Technology, Beijing, China
  • show less
    DOI: 10.1117/1.AP.5.5.056002 Cite this Article Set citation alerts
    Lang Li, Yingchi Guo, Zhichao Zhang, Zijun Shang, Chen Li, Jiaqi Wang, Liliang Gao, Lan Hai, Chunqing Gao, Shiyao Fu. Photon total angular momentum manipulation[J]. Advanced Photonics, 2023, 5(5): 056002 Copy Citation Text show less
    Concept of a TAM manipulator: structure of a TAM carried beam passes through the TAM manipulator for filtering. Beam propagation diagram of (a) the TAM separator and (b) the TAM reverser. U1 and U2, unwrappers; C1 and C2, correctors; L1 to L4, lenses; Sp, separation (filtered) plane.
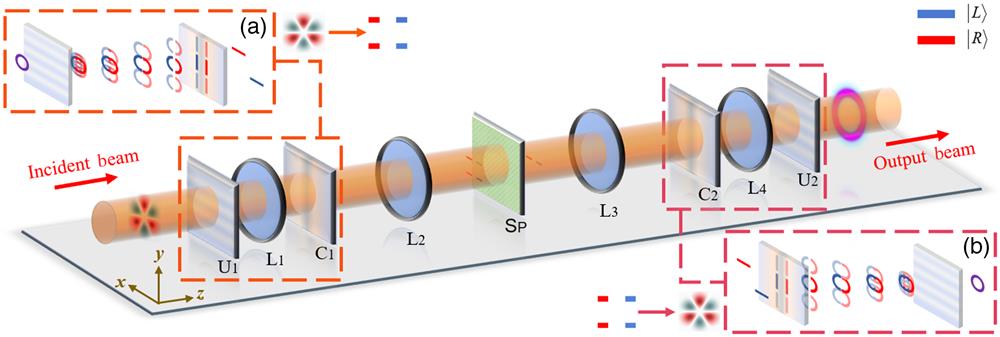
    Fig. 1. Concept of a TAM manipulator: structure of a TAM carried beam passes through the TAM manipulator for filtering. Beam propagation diagram of (a) the TAM separator and (b) the TAM reverser. U1 and U2, unwrappers; C1 and C2, correctors; L1 to L4, lenses; Sp, separation (filtered) plane.
    Details of the fabricated GPOEs. Main-axis orientation angle distributions of the designed elements for (a) the unwrapper and (b) the phase corrector. (e) Inspection of the corrector-center via polarized optical microscope. Inspection detail of the (d) unwrapper central zone and (f), (c) the corrector left and right regions.
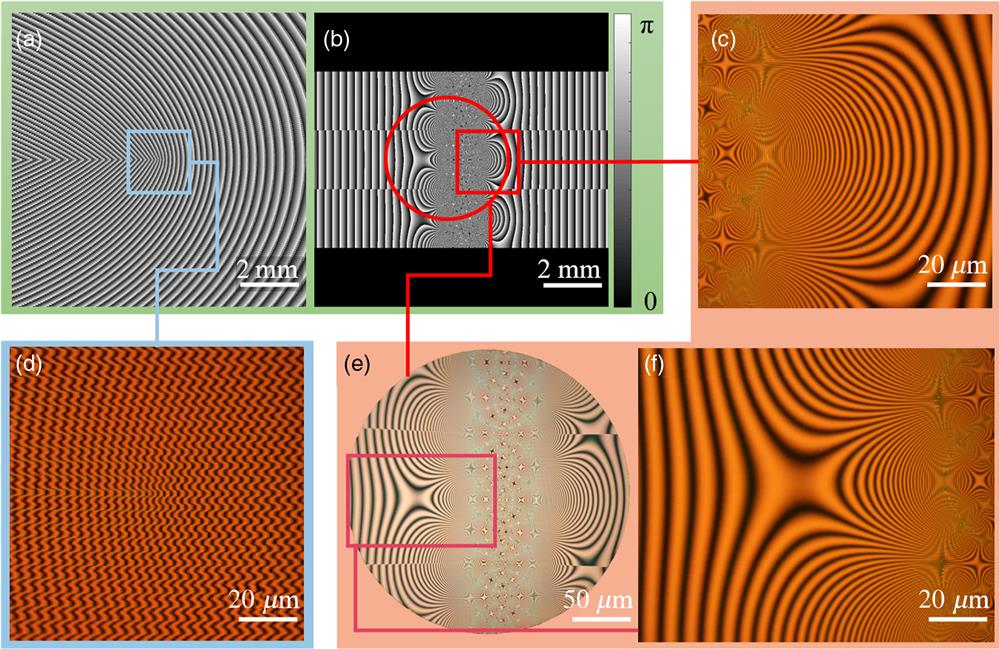
    Fig. 2. Details of the fabricated GPOEs. Main-axis orientation angle distributions of the designed elements for (a) the unwrapper and (b) the phase corrector. (e) Inspection of the corrector-center via polarized optical microscope. Inspection detail of the (d) unwrapper central zone and (f), (c) the corrector left and right regions.
    Performance of the TAM manipulator in straight-through cases. (a) The numerical simulation of various observing planes for incident beams |ψ1⟩=|L⟩|−7⟩ and |ψ2⟩=|R⟩|+8⟩. (b1) The simulated TAM spectra confusion matrix of the output beams versus input beams, where left and right circular polarizations are described as blue and red font color in axes, separately, and the OAM modes are represented by numbers. (b2) The corresponding experimentally measured results.
    Fig. 3. Performance of the TAM manipulator in straight-through cases. (a) The numerical simulation of various observing planes for incident beams |ψ1=|L|7 and |ψ2=|R|+8. (b1) The simulated TAM spectra confusion matrix of the output beams versus input beams, where left and right circular polarizations are described as blue and red font color in axes, separately, and the OAM modes are represented by numbers. (b2) The corresponding experimentally measured results.
    Performance of the manipulator in straight-through and selective-blocking cases when multi-TAM states are incident. (a) Experimental results for incident beams |Ψ5⟩,|Ψ8⟩,|Ψ9⟩,|Ψ10⟩, where output 1 is the output intensity distributions in straight-through cases, and output 2 is the output intensities distributions in selective-blocking cases. The second column is the intensity distribution at separated plane without filtering, and the fourth column is the intensity distribution at that plane after filtering. (b) TAM spectra of the output beams in the above two cases. The OAM modes are represented by topological charge, and the SAM modes are represented as L and R. The TAM spectrum distribution diagram can be divided into two parts with the gray part as the boundary, representing the results of the straight-through cases and the selective-blocking cases, respectively. Sp1 and Sp2 are the filter masks for the two cases, separately.
    Fig. 4. Performance of the manipulator in straight-through and selective-blocking cases when multi-TAM states are incident. (a) Experimental results for incident beams |Ψ5,|Ψ8,|Ψ9,|Ψ10, where output 1 is the output intensity distributions in straight-through cases, and output 2 is the output intensities distributions in selective-blocking cases. The second column is the intensity distribution at separated plane without filtering, and the fourth column is the intensity distribution at that plane after filtering. (b) TAM spectra of the output beams in the above two cases. The OAM modes are represented by topological charge, and the SAM modes are represented as L and R. The TAM spectrum distribution diagram can be divided into two parts with the gray part as the boundary, representing the results of the straight-through cases and the selective-blocking cases, respectively. Sp1 and Sp2 are the filter masks for the two cases, separately.
    Polarization distributions of experimental input and output beams. The input row shows the intensities of input beam. Output 1 is the intensity of the output beam at pass-through cases. Output 2 is the intensity of the output beam at selective-blocking cases. The arrow represents the direction of the polarizer, and the first column is the result with no polarizer.
    Fig. 5. Polarization distributions of experimental input and output beams. The input row shows the intensities of input beam. Output 1 is the intensity of the output beam at pass-through cases. Output 2 is the intensity of the output beam at selective-blocking cases. The arrow represents the direction of the polarizer, and the first column is the result with no polarizer.
    Performance of the manipulator in straight-through and selective-blocking cases when adjacent OAM states are incident. (a) Experimental results for incident beams |ΨΩ⟩, where output 1 is the output intensity distribution in straight-through cases, and output 2 is the output intensity distribution in selective-blocking cases. The second column is the intensity distribution at the separated plane without filtering, and the fourth column is the intensity distribution at that plane after filtering. The dashed lines between the second and the fourth columns are references for the location of the separated modes. (b1), (b2) The experimental TAM spectrum of output beams in the straight-through cases and selective-blocking cases, respectively, where left and right circular polarizations are denoted as blue and red color bars; the ℓ axis means the eigenvalue of the OAM mode. Sp1 and Sp2 are the filter mask for the two cases, separately. (c1), (c2) Corresponding simulated results.
    Fig. 6. Performance of the manipulator in straight-through and selective-blocking cases when adjacent OAM states are incident. (a) Experimental results for incident beams |ΨΩ, where output 1 is the output intensity distribution in straight-through cases, and output 2 is the output intensity distribution in selective-blocking cases. The second column is the intensity distribution at the separated plane without filtering, and the fourth column is the intensity distribution at that plane after filtering. The dashed lines between the second and the fourth columns are references for the location of the separated modes. (b1), (b2) The experimental TAM spectrum of output beams in the straight-through cases and selective-blocking cases, respectively, where left and right circular polarizations are denoted as blue and red color bars; the axis means the eigenvalue of the OAM mode. Sp1 and Sp2 are the filter mask for the two cases, separately. (c1), (c2) Corresponding simulated results.
    Lang Li, Yingchi Guo, Zhichao Zhang, Zijun Shang, Chen Li, Jiaqi Wang, Liliang Gao, Lan Hai, Chunqing Gao, Shiyao Fu. Photon total angular momentum manipulation[J]. Advanced Photonics, 2023, 5(5): 056002
    Download Citation