• Acta Physica Sinica
  • Vol. 69, Issue 16, 167102-1 (2020)
Fei-Long Song1、2, Yu-Nuan Wang1、3, Feng Zhang4, Shi-Yao Wu1、2, Xin Xie1、2, Jing-Nan Yang1、2, Si-Bai Sun1、2, Jian-Chen Dang1、2, Shan Xiao1、2, Long-Long Yang1、2, Hai-Zheng Zhong4, and Xiu-Lai Xu1、2、5、*
Author Affiliations
  • 1Beijing National Laboratory for Condensed Matter Physics, Institute of Physics, Chinese Academy of Sciences, Beijing 100190, China
  • 2CAS Center for Excellence in Topological Quantum Computation and School of Physical Sciences, University of Chinese Academy of Sciences, Beijing 100049, China
  • 3School of Science, Beijing Jiaotong University, Beijing 100044, China
  • 4School of Materials Science & Engineering, Beijing Institute of Technology, Beijing 100081, China
  • 5Songshan Lake Materials Laboratory, Dongguan 523808, China
  • show less
    DOI: 10.7498/aps.69.20200646 Cite this Article
    Fei-Long Song, Yu-Nuan Wang, Feng Zhang, Shi-Yao Wu, Xin Xie, Jing-Nan Yang, Si-Bai Sun, Jian-Chen Dang, Shan Xiao, Long-Long Yang, Hai-Zheng Zhong, Xiu-Lai Xu. The g-factor anisotropy of trapped excitons in CH3NH3PbBr3 perovskite [J]. Acta Physica Sinica, 2020, 69(16): 167102-1 Copy Citation Text show less
    Schematic diagram of the confocal microscope measurement system with a vector magnetic field at low temperature(4 K). The excitation laser with the wavelength of 442 nm is coupled to the measurement system through an optical fiber, the PL of the sample is coupled out to the system through another optical fiber when the sample is excited by the laser, the PL signals are collected by a spectrometer and CCD detector. A SEM image of nanowire is shown in the left bottom of Fig. 1, the scale bar is 1 μm.
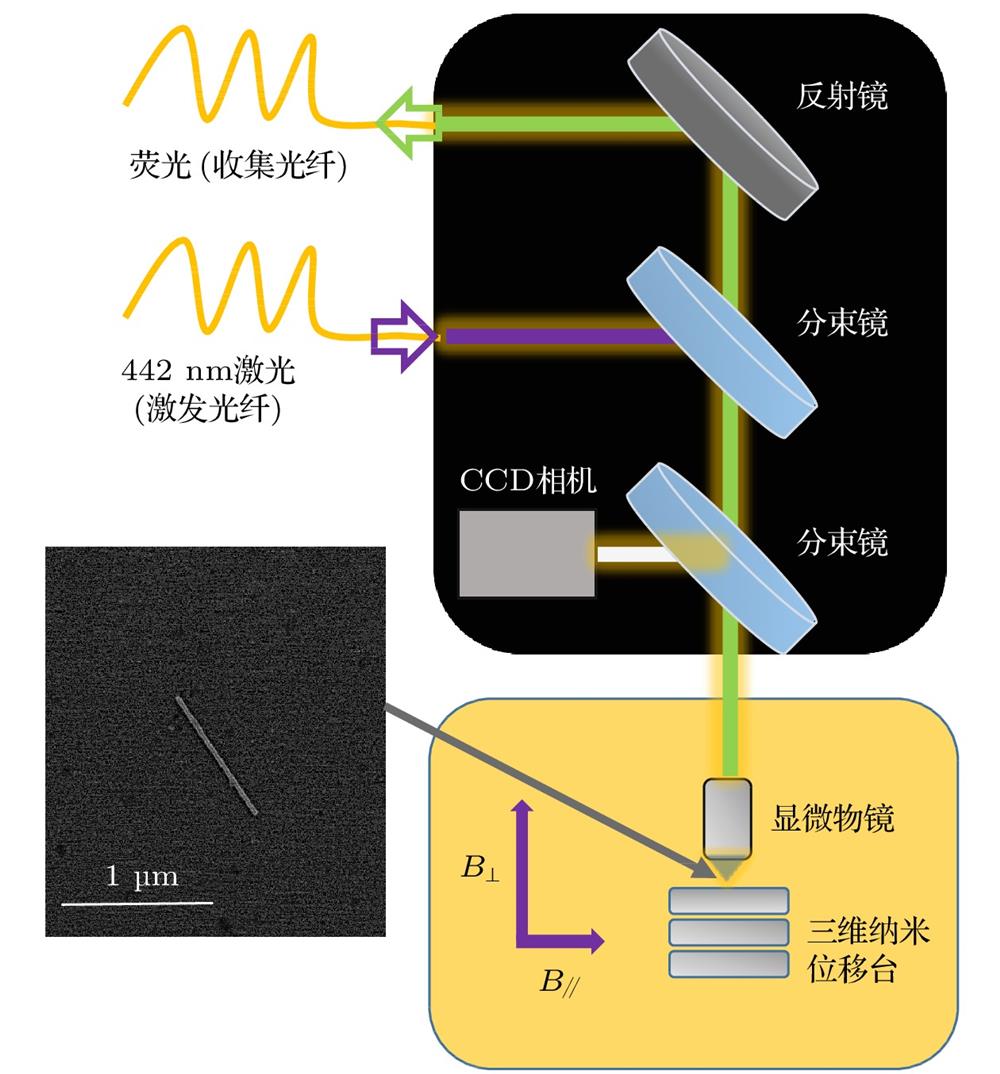
    Fig. 1. Schematic diagram of the confocal microscope measurement system with a vector magnetic field at low temperature(4 K). The excitation laser with the wavelength of 442 nm is coupled to the measurement system through an optical fiber, the PL of the sample is coupled out to the system through another optical fiber when the sample is excited by the laser, the PL signals are collected by a spectrometer and CCD detector. A SEM image of nanowire is shown in the left bottom of Fig. 1, the scale bar is 1 μm.
    Power dependent PL spectra of different nanowires at 4.2 K: (a) PL spectra from free excitons and defect states with broader linewidth; (b) PL spectra from free excitons and defect states with narrow linewidth; (c) PL spectra from trapped exciton and its phonon replica at lower energy side with a phonon energy of 9.5 meV; (d) PL spectra from trapped excitons and hot polarons at higher energy side with a phonon energy of 5.4 meV.
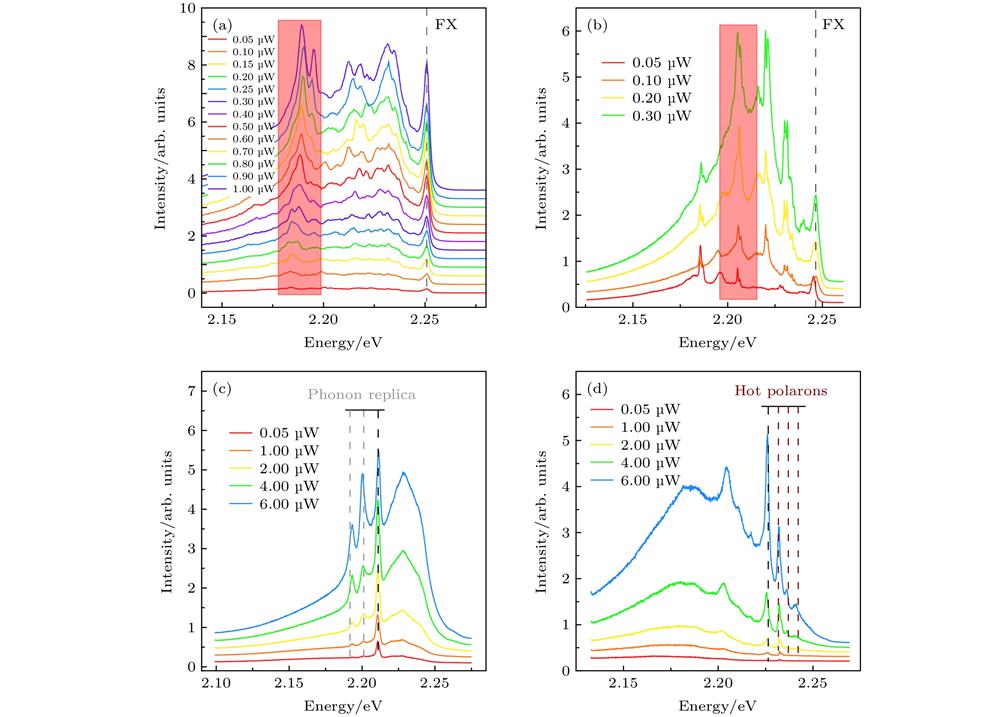
    Fig. 2. Power dependent PL spectra of different nanowires at 4.2 K: (a) PL spectra from free excitons and defect states with broader linewidth; (b) PL spectra from free excitons and defect states with narrow linewidth; (c) PL spectra from trapped exciton and its phonon replica at lower energy side with a phonon energy of 9.5 meV; (d) PL spectra from trapped excitons and hot polarons at higher energy side with a phonon energy of 5.4 meV.
    PL spectra as a function of magnetic field at low temperature: (a) The peak of free excitons is not effected by the magnetic field while Zeeman splitting is observed for trapped excitons; (b) no splitting observed for both free excitons and trapped excitons; (c) the trapped excitons with a Zeeman effect but not diamagnetic effect; (d) the trapped excitons with both Zeeman effect and diamagnetic effect.
    Fig. 3. PL spectra as a function of magnetic field at low temperature: (a) The peak of free excitons is not effected by the magnetic field while Zeeman splitting is observed for trapped excitons; (b) no splitting observed for both free excitons and trapped excitons; (c) the trapped excitons with a Zeeman effect but not diamagnetic effect; (d) the trapped excitons with both Zeeman effect and diamagnetic effect.
    (a) PL spectra of trapped excitons as a function of magnetic field; (b) (c) g factors of different trapped excitons; (d) (e) the diamagnetic shifts of different trapped excitons.
    Fig. 4. (a) PL spectra of trapped excitons as a function of magnetic field; (b) (c) g factors of different trapped excitons; (d) (e) the diamagnetic shifts of different trapped excitons.
    The angle dependent PL spectra of trapped exciton (a) and the angle dependent g factors (b) between the magnetic field and the growth direction.
    Fig. 5. The angle dependent PL spectra of trapped exciton (a) and the angle dependent g factors (b) between the magnetic field and the growth direction.
    Fei-Long Song, Yu-Nuan Wang, Feng Zhang, Shi-Yao Wu, Xin Xie, Jing-Nan Yang, Si-Bai Sun, Jian-Chen Dang, Shan Xiao, Long-Long Yang, Hai-Zheng Zhong, Xiu-Lai Xu. The g-factor anisotropy of trapped excitons in CH3NH3PbBr3 perovskite [J]. Acta Physica Sinica, 2020, 69(16): 167102-1
    Download Citation