• Photonics Research
  • Vol. 10, Issue 2, 601 (2022)
Dianqiang Su1、2, Pablo Solano3, Jeffrey D. Wack4, Luis A. Orozco4, and Yanting Zhao1、2、*
Author Affiliations
  • 1State Key Laboratory of Quantum Optics and Quantum Optics Devices, Institute of Laser Spectroscopy, Shanxi University, Taiyuan 030006, China
  • 2Collaborative Innovation Center of Extreme Optics, Shanxi University, Taiyuan 030006, China
  • 3Departamento de Física, Facultad de Ciencias Físicas y Matemáticas, Universidad de Concepción, Concepción, Chile
  • 4Joint Quantum Institute, Department of Physics and NIST, University of Maryland, College Park, Maryland 20742, USA
  • show less
    DOI: 10.1364/PRJ.440991 Cite this Article Set citation alerts
    Dianqiang Su, Pablo Solano, Jeffrey D. Wack, Luis A. Orozco, Yanting Zhao. Torsional optomechanical cooling of a nanofiber[J]. Photonics Research, 2022, 10(2): 601 Copy Citation Text show less
    (a) Schematic of the ONF with two effective polarization axes associated with an ordinary and an extraordinary indices of refraction, aligned with the optical axis, but at an angle Δθ with the input light polarization. The fiber is clamped (not shown) in the unmodified section. (b) Calculated relative amplitude of the first torsional mode. The red dashed lines indicate where the waist ends and the torsion extends into the tapered region. (c) Schematic of the apparatus. Probe and drive laser beams of 852 and 780 nm wavelength respectively counterpropagate with independent polarization control by motorized half-wave plates. The signal output goes to a half-wave plate to set the detection basis and then to a polarizing beam splitter (PBS) that separates the light into two polarization components, falling into a balanced photodiode pair.
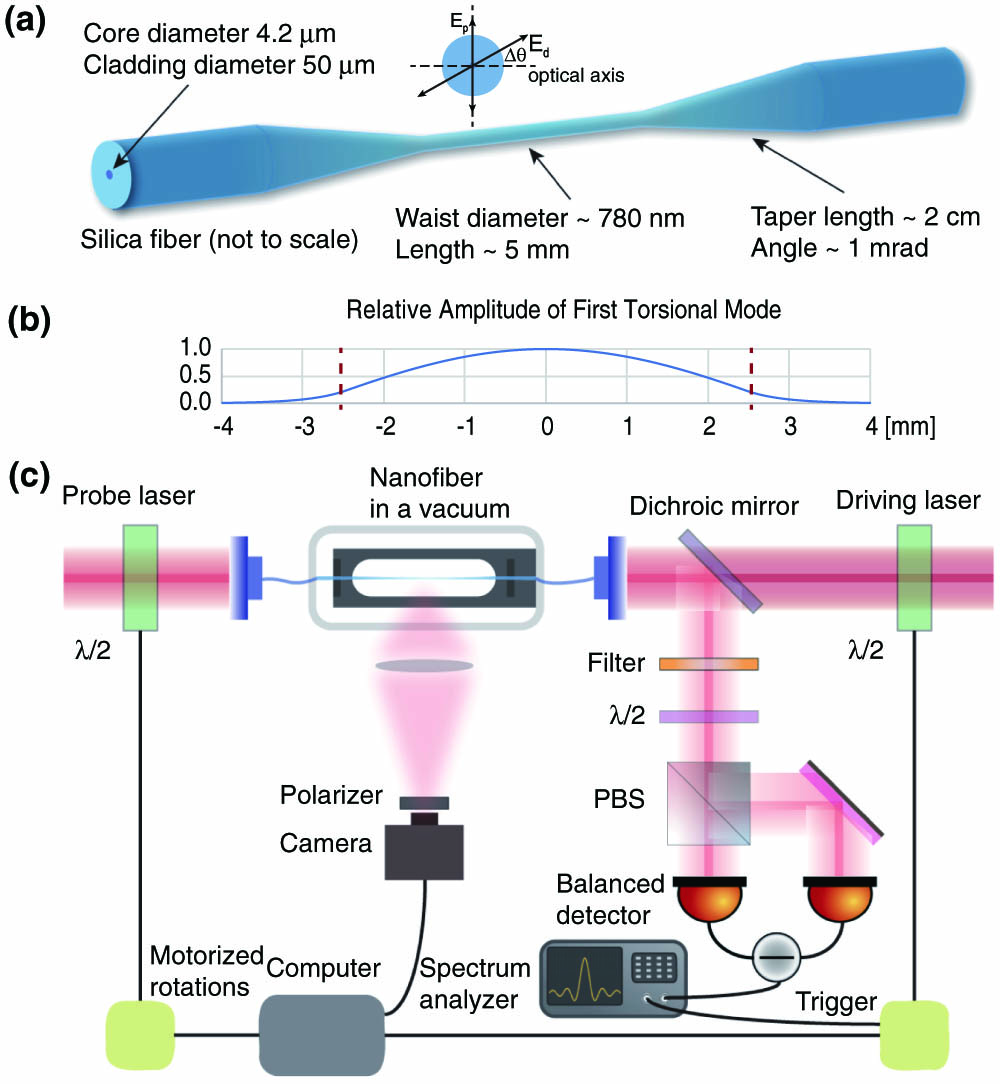
    Fig. 1. (a) Schematic of the ONF with two effective polarization axes associated with an ordinary and an extraordinary indices of refraction, aligned with the optical axis, but at an angle Δθ with the input light polarization. The fiber is clamped (not shown) in the unmodified section. (b) Calculated relative amplitude of the first torsional mode. The red dashed lines indicate where the waist ends and the torsion extends into the tapered region. (c) Schematic of the apparatus. Probe and drive laser beams of 852 and 780 nm wavelength respectively counterpropagate with independent polarization control by motorized half-wave plates. The signal output goes to a half-wave plate to set the detection basis and then to a polarizing beam splitter (PBS) that separates the light into two polarization components, falling into a balanced photodiode pair.
    (a) Time series of the amplitude fluctuations of the undriven first torsional mode. The plot shows 1 point every 20 from the 20,000 samples. The spectrum analyzer is fixed at the resonance frequency with RBW 50 Hz and unlimited VBW. (b) Histogram of the data in (a) with 50 bins, showing an MB distribution. (c) MB distribution of the amplitude fluctuations of the first torsional mode for three different drive angles Δθ. The continuous lines are fits to the MB distribution. The black line is the fit to the data from (a) with no drive, agreeing with the green data at the appropriate angle Δθ. The inset shows the ratio of the noise amplitudes between the driven and undriven cases for the first torsional mode as a function of the drive angle Δθ under different experimental parameters. The solid gray line is the expected sinusoidal behavior. The dashed black lines bind the thermal noise level. The color arrows in the inset indicate the Δθ for the data in the main figure. See Table 1 for the extracted temperature changes.
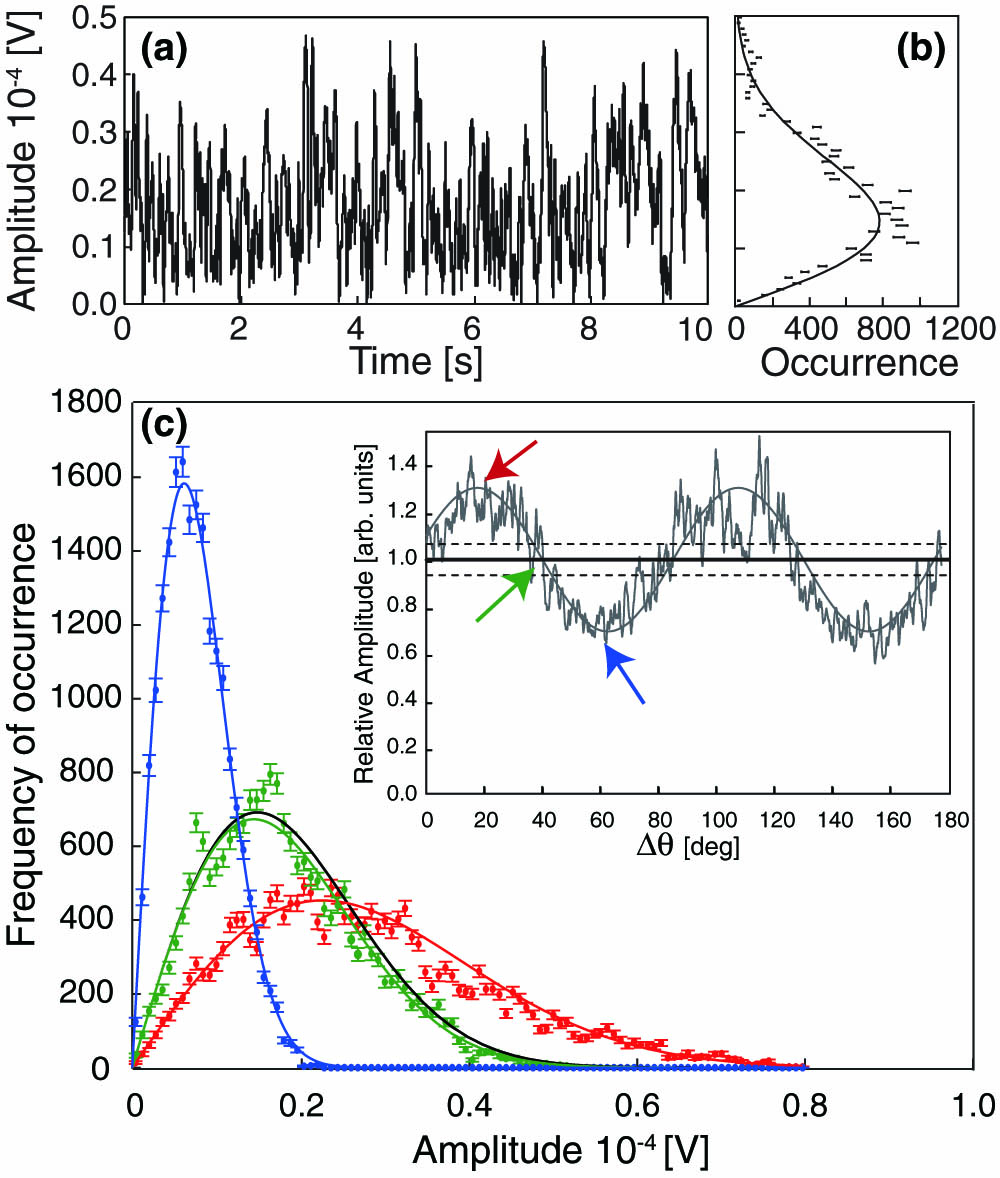
    Fig. 2. (a) Time series of the amplitude fluctuations of the undriven first torsional mode. The plot shows 1 point every 20 from the 20,000 samples. The spectrum analyzer is fixed at the resonance frequency with RBW 50 Hz and unlimited VBW. (b) Histogram of the data in (a) with 50 bins, showing an MB distribution. (c) MB distribution of the amplitude fluctuations of the first torsional mode for three different drive angles Δθ. The continuous lines are fits to the MB distribution. The black line is the fit to the data from (a) with no drive, agreeing with the green data at the appropriate angle Δθ. The inset shows the ratio of the noise amplitudes between the driven and undriven cases for the first torsional mode as a function of the drive angle Δθ under different experimental parameters. The solid gray line is the expected sinusoidal behavior. The dashed black lines bind the thermal noise level. The color arrows in the inset indicate the Δθ for the data in the main figure. See Table 1 for the extracted temperature changes.
    Power spectral density as a function of drive power of the first torsional mode. (a) Evolution of the PSD as the drive power increases with probe 50 μW. The spectra are plotted with their center frequencies aligned for ease of presentation. The no drive resonance is at 189,664 Hz. The color code typifies the relative cooling with respect to no drive T0. The continuous black line on the 0 drive (red) spectrum is a fit to the PSD from Eq. (10). (b) Change in the PSD HWHM (Γeff) as a function of the drive power for the amplitude spectra shown on part (a) with the linear trend as a continuous green line.
    Fig. 3. Power spectral density as a function of drive power of the first torsional mode. (a) Evolution of the PSD as the drive power increases with probe 50 μW. The spectra are plotted with their center frequencies aligned for ease of presentation. The no drive resonance is at 189,664 Hz. The color code typifies the relative cooling with respect to no drive T0. The continuous black line on the 0 drive (red) spectrum is a fit to the PSD from Eq. (10). (b) Change in the PSD HWHM (Γeff) as a function of the drive power for the amplitude spectra shown on part (a) with the linear trend as a continuous green line.
    Frequency shift of the resonance of the first torsional mode as a function of the drive power (RBW 1 Hz, VBW 1 Hz). The green solid line is a fit to an offset, a linear term, and cubic root starting at the 0.5 mW point. The green dashed lines show the extrapolations from the fit. The inset shows the frequency shift of the resonance as a function of drive polarization angle for a fixed drive power of 10 mW. The red dashed line is a fit to a sinusoidal function.
    Fig. 4. Frequency shift of the resonance of the first torsional mode as a function of the drive power (RBW 1 Hz, VBW 1 Hz). The green solid line is a fit to an offset, a linear term, and cubic root starting at the 0.5 mW point. The green dashed lines show the extrapolations from the fit. The inset shows the frequency shift of the resonance as a function of drive polarization angle for a fixed drive power of 10 mW. The red dashed line is a fit to a sinusoidal function.
    (a) Feedback schematic. (b) Power HWHM of the PSD as a function of drive angle; the fit errors are smaller than the circles. The RBW and VBW for the measurements of the spectra are 1 Hz with drive at 1 mW and probe at 60 μW. The dashed line corresponds to the case without drive and sets the reference for an effective room temperature.
    Fig. 5. (a) Feedback schematic. (b) Power HWHM of the PSD as a function of drive angle; the fit errors are smaller than the circles. The RBW and VBW for the measurements of the spectra are 1 Hz with drive at 1 mW and probe at 60 μW. The dashed line corresponds to the case without drive and sets the reference for an effective room temperature.
    Δθ, color—, black15°, red37.5°, green60°, blue
    Drive power [mW]0111
    1/Slope [1010  V2]4.14±0.0610.02±0.134.000±0.0050.746±0.005
    TΔθ/T37.5°1.04±0.022.56±0.031±0.0020.187±0.001
    V2/V21.30±0.101.29±0.011.26±0.0101.26±0.010
    Table 1. Parameters Extracted from the Fits to MB Distributions for the Plots in Fig. 2
    Dianqiang Su, Pablo Solano, Jeffrey D. Wack, Luis A. Orozco, Yanting Zhao. Torsional optomechanical cooling of a nanofiber[J]. Photonics Research, 2022, 10(2): 601
    Download Citation