
Bo He, Chen Wang, Changqing Sun, Guang Yang, Xiangming Wang, Yadong Su. Effect of Substrate Preheating on Microstructure and Properties of Laser-Deposited TA15/GH4169 Composite Structure[J]. Chinese Journal of Lasers, 2020, 47(1): 0102002
- Chinese Journal of Lasers
- Vol. 47, Issue 1, 0102002 (2020)
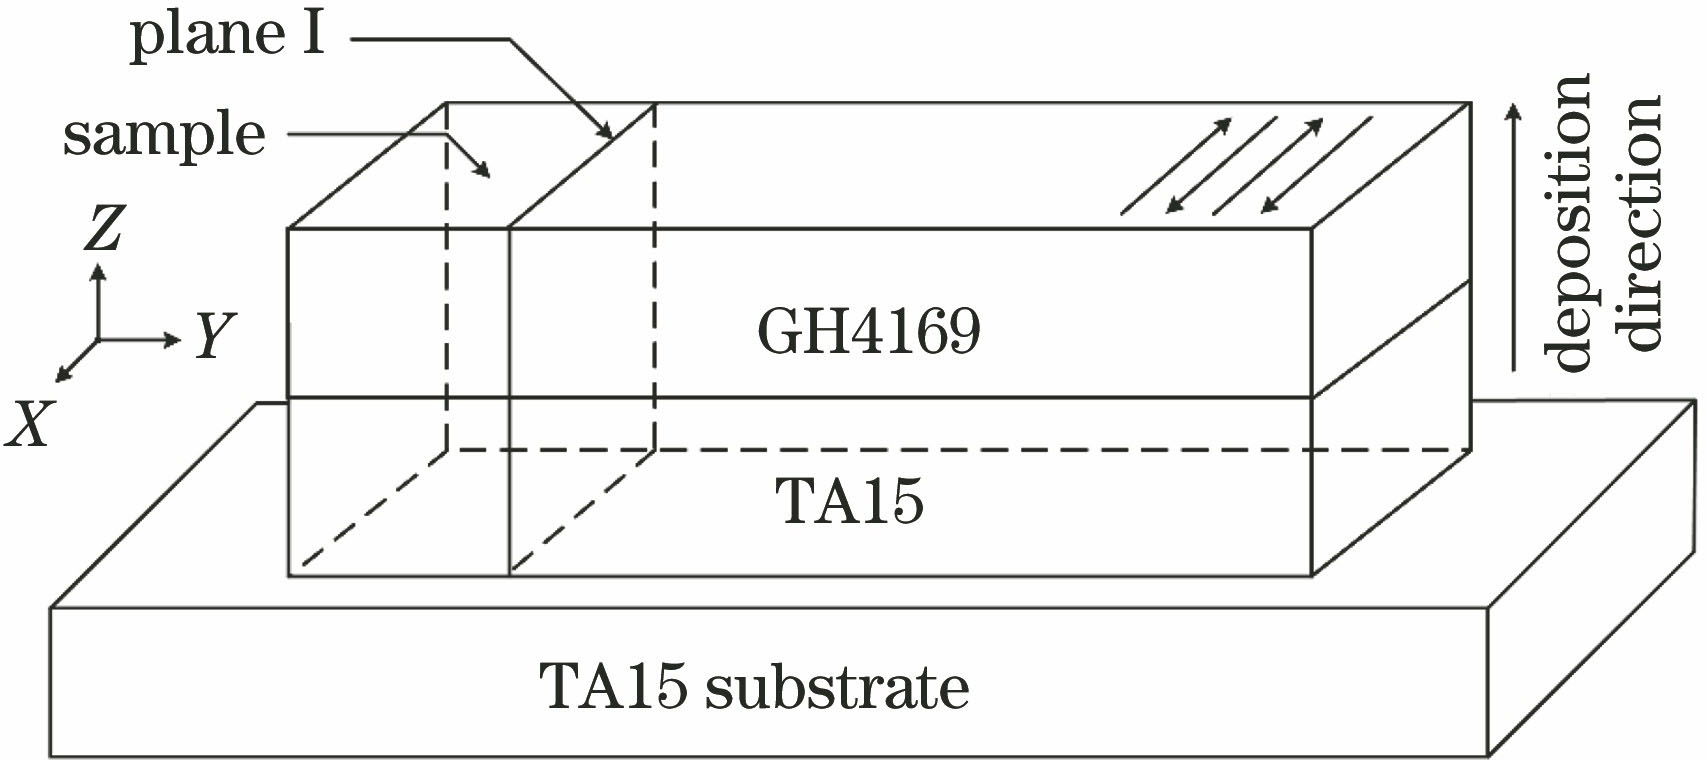
Fig. 1. Schematic of composite structure
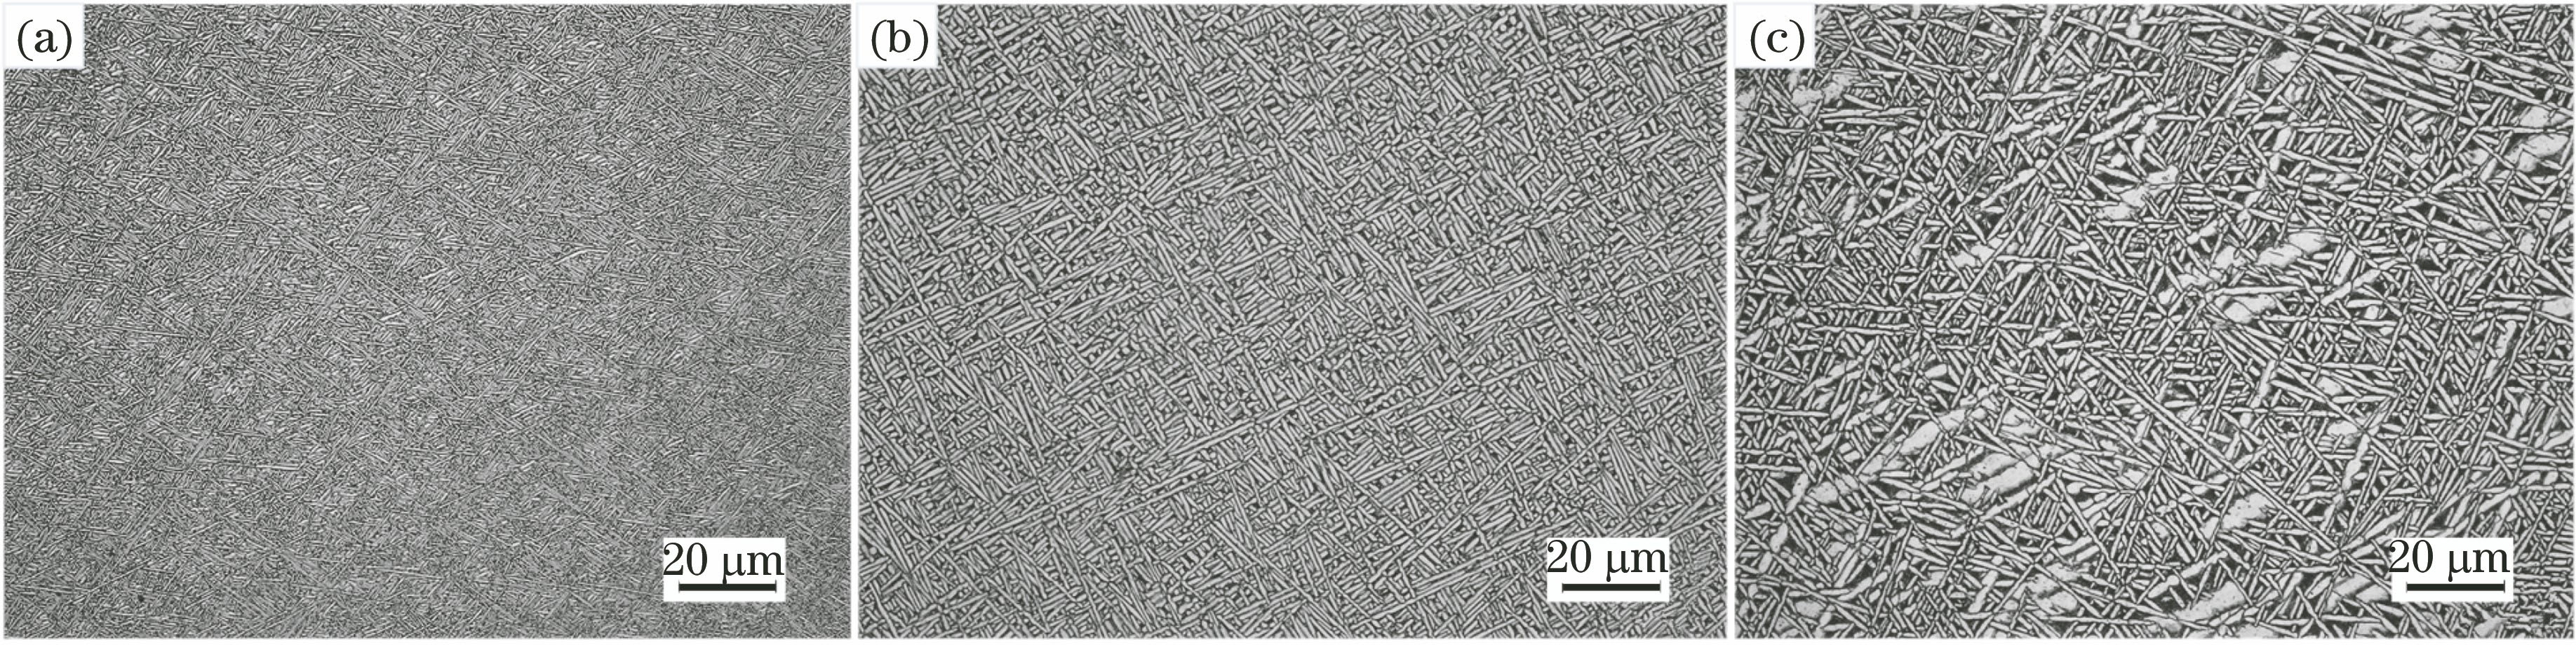
Fig. 2. OM images of TA15 alloy in TA15/GH4169 composite structure deposited on substrate with different preheating temperatures. (a) Without preheating; (b) 100 ℃; (c) 400 ℃
Fig. 3. OM images of TA15/GH4169 composite structure interface with different preheating temperatures of substrate. (a) Without preheating; (b) 100 ℃; (c) 400 ℃
Fig. 4. SEM images and EDS analysis results of GH4169 alloy in TA15/GH4169 composite structure deposited on substrate with different preheating temperatures. (a) Without preheating; (b) 400 ℃; (c) EDS analysis results of white rectangle area in Fig. 4 (b)
Fig. 5. Interface morphologies of TA15/GH4169 composite structure deposited on substrate at 400 ℃; (a) SEM image at interface; (b) interface between TA15 side alloy and transition zone; (c) interface between transition zone and GH4169 side alloy
Fig. 6. Residual stress curves of GH4169 side alloy
Fig. 7. Average residual stress of GH4169 side alloy
Fig. 8. Microhardnesses distribution curves of TA15/GH4169 composite structure deposited on substrate with different preheating temperatures
|
Table 1. Thermophysical parameters of TA15 titanium alloy
|
Table 2. Thermophysical parameters of GH4169 alloy
|
Table 3. Process parameters of LDM
| |||||||||||||||||||||||||||||||||||||||||||||||
Table 4. EDS analysis results at different positions marked in Fig. 5

Set citation alerts for the article
Please enter your email address
© Copyright 2018-2021 | Chinese Laser Press. All Rights Reserved 沪ICP备15018463号-20