• Chinese Optics Letters
  • Vol. 17, Issue 8, 081402 (2019)
Qin Li1, Wenbo Li2, Wei Chu2, Yuxiang Cao1, Wencheng Zhang1, Hongliang Ma1, Zuanming Jin1, and Ye Dai1、*
Author Affiliations
  • 1Department of Physics, Shanghai University, Shanghai 200444, China
  • 2State Key Laboratory of High Field Laser Physics, Shanghai Institute of Optics and Fine Mechanics, Chinese Academy of Sciences, Shanghai 201800, China
  • show less
    DOI: 10.3788/COL201917.081402 Cite this Article Set citation alerts
    Qin Li, Wenbo Li, Wei Chu, Yuxiang Cao, Wencheng Zhang, Hongliang Ma, Zuanming Jin, Ye Dai. Effect of spatio-temporal coupling on ultrafast laser direct writing in glass[J]. Chinese Optics Letters, 2019, 17(8): 081402 Copy Citation Text show less
    Schematic diagram of the experimental setup. The insert demonstrates two scanning directions along X and Y, and the transmission direction is along Z. A red box surrounded by the dotted line represents processing sample details.
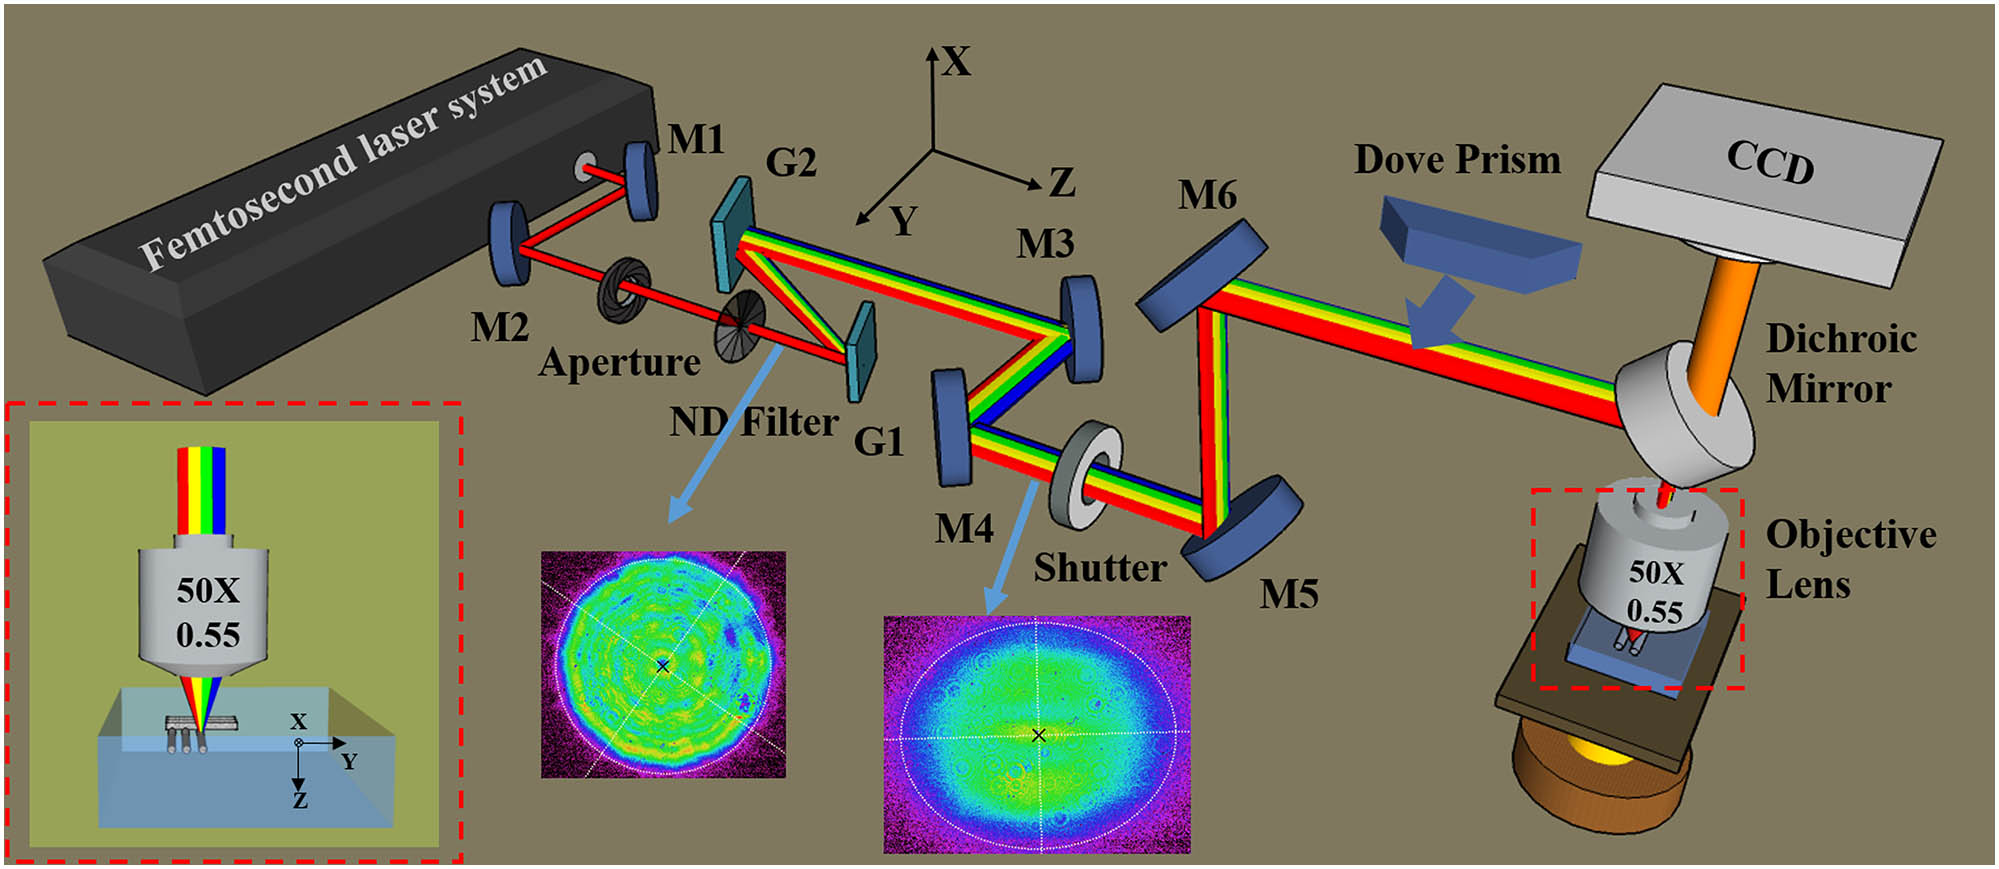
    Fig. 1. Schematic diagram of the experimental setup. The insert demonstrates two scanning directions along X and Y, and the transmission direction is along Z. A red box surrounded by the dotted line represents processing sample details.
    (a) Optical images of transverse sections of the asymmetric microstructures with tilted heads induced by the laser pulses transmitting (b) without a Dove prism and (d) with a Dove prism. The type A microstructures in (a) and (c) are induced by a CF system. The type B to E ones are four groups of tilted microstructures induced by the SSTF pulses with varying grating distances. The red bar is 5 μm.
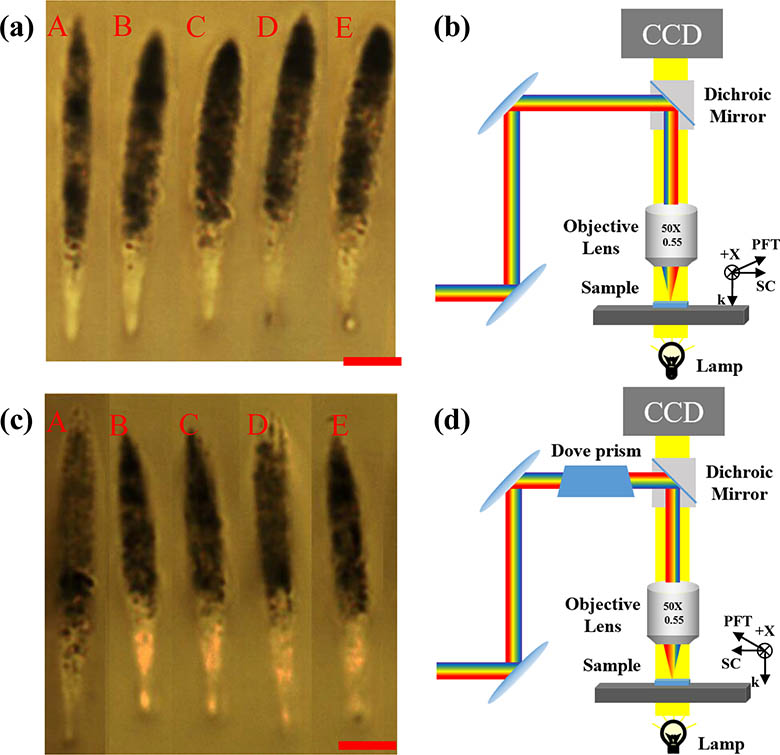
    Fig. 2. (a) Optical images of transverse sections of the asymmetric microstructures with tilted heads induced by the laser pulses transmitting (b) without a Dove prism and (d) with a Dove prism. The type A microstructures in (a) and (c) are induced by a CF system. The type B to E ones are four groups of tilted microstructures induced by the SSTF pulses with varying grating distances. The red bar is 5 μm.
    Optical images of transverse sections of written lines with different tilted angles. Two scanning directions are, respectively, along +X and −X. Dependence of the introduced GDD on the grating distances is shown by the black solid line. The top coordinate presents a trend of pulse duration, which was measured behind the gratings. The pulse profiles show three states of TC by changing the GDD. The red bar is 5 μm.
    Fig. 3. Optical images of transverse sections of written lines with different tilted angles. Two scanning directions are, respectively, along +X and X. Dependence of the introduced GDD on the grating distances is shown by the black solid line. The top coordinate presents a trend of pulse duration, which was measured behind the gratings. The pulse profiles show three states of TC by changing the GDD. The red bar is 5 μm.
    (a) Evolution of PFT along focusing for five different GDD cases. The SC will disappear because the laser beam converges to a point. The PFT with different GDD is all about −16.8 fs/μm at the focal plane when PFT depends on the AD. (b) Relative intensity threshold evolution during focusing for the five cases. The zero GDD case (black line) is larger than other cases and symmetric on the focus. When the GDD is positive, the peak intensity slightly moves to the left side of the axis with X = 0. The situation is opposite when the GDD is negative. Regardless of the positive or negative non-zero GDD cases, the peak intensity of different GDD cases with the same value is identical. The peak intensity is lower with the GDD increasing.
    Fig. 4. (a) Evolution of PFT along focusing for five different GDD cases. The SC will disappear because the laser beam converges to a point. The PFT with different GDD is all about 16.8fs/μm at the focal plane when PFT depends on the AD. (b) Relative intensity threshold evolution during focusing for the five cases. The zero GDD case (black line) is larger than other cases and symmetric on the focus. When the GDD is positive, the peak intensity slightly moves to the left side of the axis with X=0. The situation is opposite when the GDD is negative. Regardless of the positive or negative non-zero GDD cases, the peak intensity of different GDD cases with the same value is identical. The peak intensity is lower with the GDD increasing.
    Optical microscope images of the written lines with various pulse energies in the cases of CF (right) and SSTF (left) systems. Two lines of each group were independently written along +Y and −Y. k indicates the directions of the laser propagation. (a) Ordinary optical images. (b) Birefringence of the lines under cross-polarization illumination. (c) The relative intensity variation of the birefringence signal from the written lines. The red bar is 20 μm.
    Fig. 5. Optical microscope images of the written lines with various pulse energies in the cases of CF (right) and SSTF (left) systems. Two lines of each group were independently written along +Y and Y. k indicates the directions of the laser propagation. (a) Ordinary optical images. (b) Birefringence of the lines under cross-polarization illumination. (c) The relative intensity variation of the birefringence signal from the written lines. The red bar is 20 μm.
    Qin Li, Wenbo Li, Wei Chu, Yuxiang Cao, Wencheng Zhang, Hongliang Ma, Zuanming Jin, Ye Dai. Effect of spatio-temporal coupling on ultrafast laser direct writing in glass[J]. Chinese Optics Letters, 2019, 17(8): 081402
    Download Citation