• Chinese Optics Letters
  • Vol. 20, Issue 10, 100002 (2022)
Lin Zhang1, Jiamin Liu1, Hao Jiang1、*, Honggang Gu1, and Shiyuan Liu1、2、**
Author Affiliations
  • 1State Key Laboratory of Digital Manufacturing Equipment and Technology, Huazhong University of Science and Technology, Wuhan 430074, China
  • 2Optics Valley Laboratory, Wuhan 430074, China
  • show less
    DOI: 10.3788/COL202220.100002 Cite this Article Set citation alerts
    Lin Zhang, Jiamin Liu, Hao Jiang, Honggang Gu, Shiyuan Liu. Layer-dependent photoexcited carrier dynamics of WS2 observed using single pulse pump probe method[J]. Chinese Optics Letters, 2022, 20(10): 100002 Copy Citation Text show less
    Characterization of the WS2 films with different layers used in this study. (a) Optical image of sample with size of 10 mm × 10 mm. The WS2 film was plated on a 0.3 mm sapphire substrate by the CVD method. (b) Raman spectra of the three-layer WS2 at different points. (c)–(e) Raman spectra of WS2 films with 1–5 layers. (f)–(h) The surface roughness of the 1L, 3L, and 5L samples characterized by AFM.
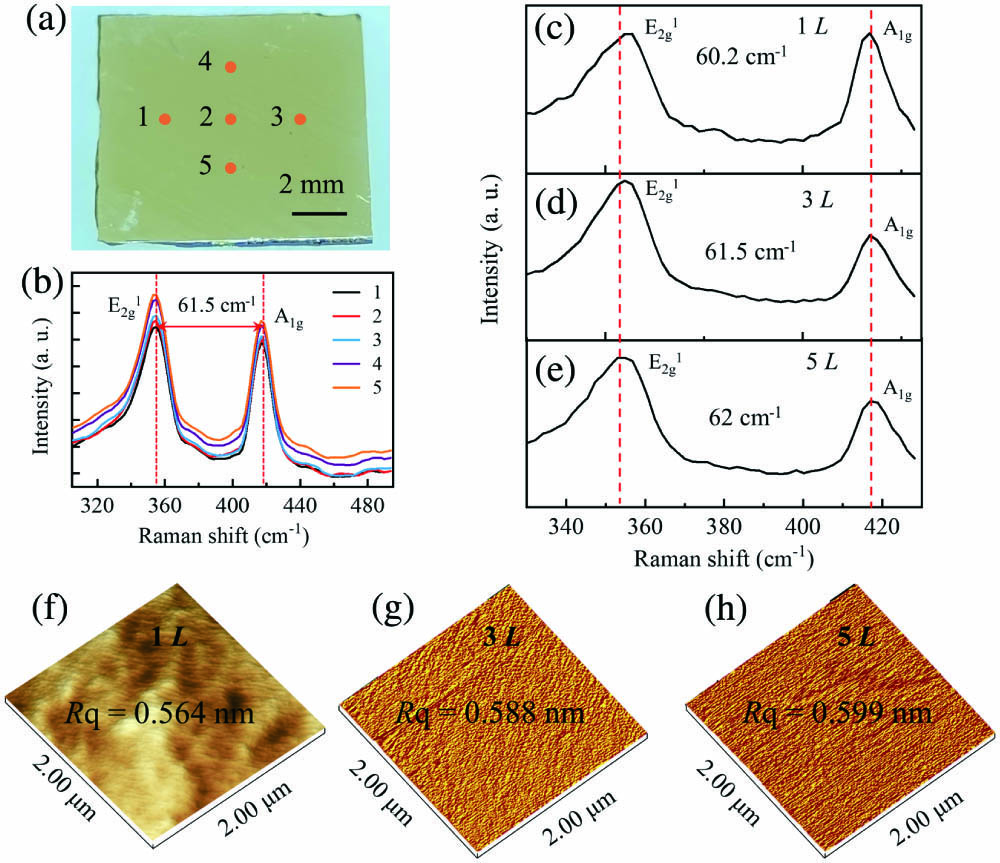
    Fig. 1. Characterization of the WS2 films with different layers used in this study. (a) Optical image of sample with size of 10 mm × 10 mm. The WS2 film was plated on a 0.3 mm sapphire substrate by the CVD method. (b) Raman spectra of the three-layer WS2 at different points. (c)–(e) Raman spectra of WS2 films with 1–5 layers. (f)–(h) The surface roughness of the 1L, 3L, and 5L samples characterized by AFM.
    (a) Schematic diagram of the pump-probe-based optical configuration. (b) Schematic diagram of the marked area in (a). The probe light spot size is smaller than the pump light spot and falls in the center of the pump light spot on the sample. NPBS, non-polarized beam splitter; P, polarizer; F, neutral filter wheel; M, mirror; S, mechanical shutter; L, lens.
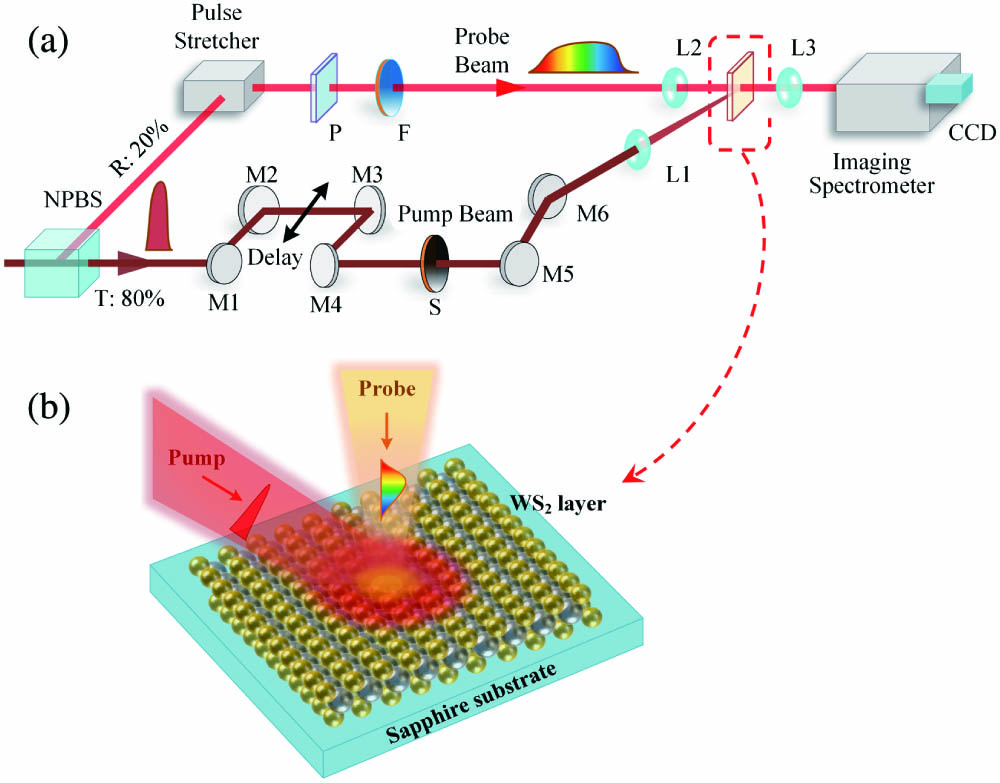
    Fig. 2. (a) Schematic diagram of the pump-probe-based optical configuration. (b) Schematic diagram of the marked area in (a). The probe light spot size is smaller than the pump light spot and falls in the center of the pump light spot on the sample. NPBS, non-polarized beam splitter; P, polarizer; F, neutral filter wheel; M, mirror; S, mechanical shutter; L, lens.
    (a) Static spectrum I0 (black line) and dynamic spectrum I1 (blue line). The time of pump excitation is marked. (b) Spectrum after differential processing. The open circles are the measured data, and the solid line represents the corresponding fitting result using a biexponential function. The spectra shown in this figure are the results of the three-layer WS2 sample.
    Fig. 3. (a) Static spectrum I0 (black line) and dynamic spectrum I1 (blue line). The time of pump excitation is marked. (b) Spectrum after differential processing. The open circles are the measured data, and the solid line represents the corresponding fitting result using a biexponential function. The spectra shown in this figure are the results of the three-layer WS2 sample.
    Temporal evolution of the transmitted probe light intensity ΔI/I0 of the WS2 films with different layers (1L, 3L, and 5L). The open circles are extracted from the measured spectrum, and the solid lines are the results of fitting using a biexponential function.
    Fig. 4. Temporal evolution of the transmitted probe light intensity ΔI/I0 of the WS2 films with different layers (1L, 3L, and 5L). The open circles are extracted from the measured spectrum, and the solid lines are the results of fitting using a biexponential function.
    (a) Characteristic time of the carrier excitation process as a function of the material layers. (b) The layer dependence of the carrier fast decay characteristic time and (c) the slow decay characteristic time in the process of carrier decay. The corresponding solid lines in (b) and (c) are the fitting results using an exponential function.
    Fig. 5. (a) Characteristic time of the carrier excitation process as a function of the material layers. (b) The layer dependence of the carrier fast decay characteristic time and (c) the slow decay characteristic time in the process of carrier decay. The corresponding solid lines in (b) and (c) are the fitting results using an exponential function.
    ParametersLayers
    1L3L5L
    τ2/ps20.98.43.9
    τ3/ps139.2338.1673.4
    Table 1. The Characteristic Times τ2 and τ3 of Different Layers
    Lin Zhang, Jiamin Liu, Hao Jiang, Honggang Gu, Shiyuan Liu. Layer-dependent photoexcited carrier dynamics of WS2 observed using single pulse pump probe method[J]. Chinese Optics Letters, 2022, 20(10): 100002
    Download Citation