
Xiao-Yan Sun, Yu-Ru Zhang, Sen Chai, You-Nian Wang, Yan-Yan Chu, Jian-Xin He. Effect of radio frequency bias on plasma characteristics of inductively coupled argon discharge based on fluid simulations[J]. Chinese Physics B, 2020, 29(9):
- Chinese Physics B
- Vol. 29, Issue 9, (2020)
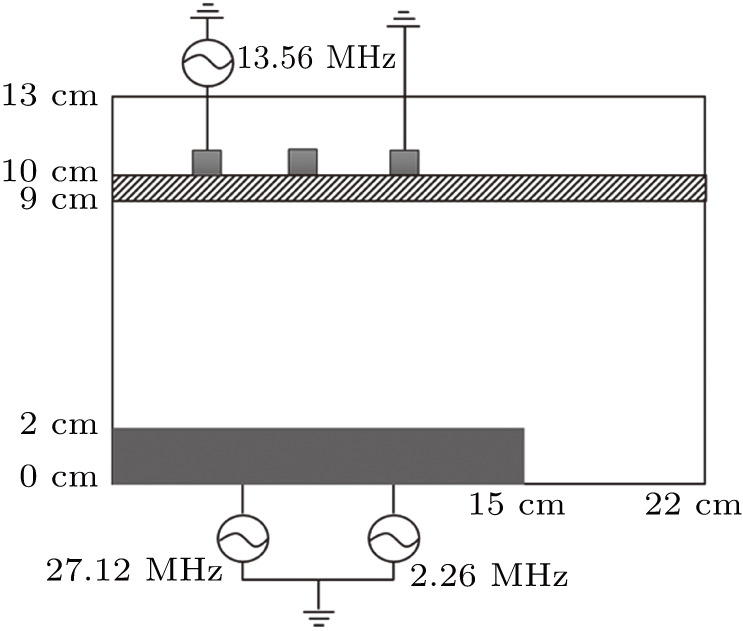
Fig. 1. Structural diagram of cylindrical ICP reactor.
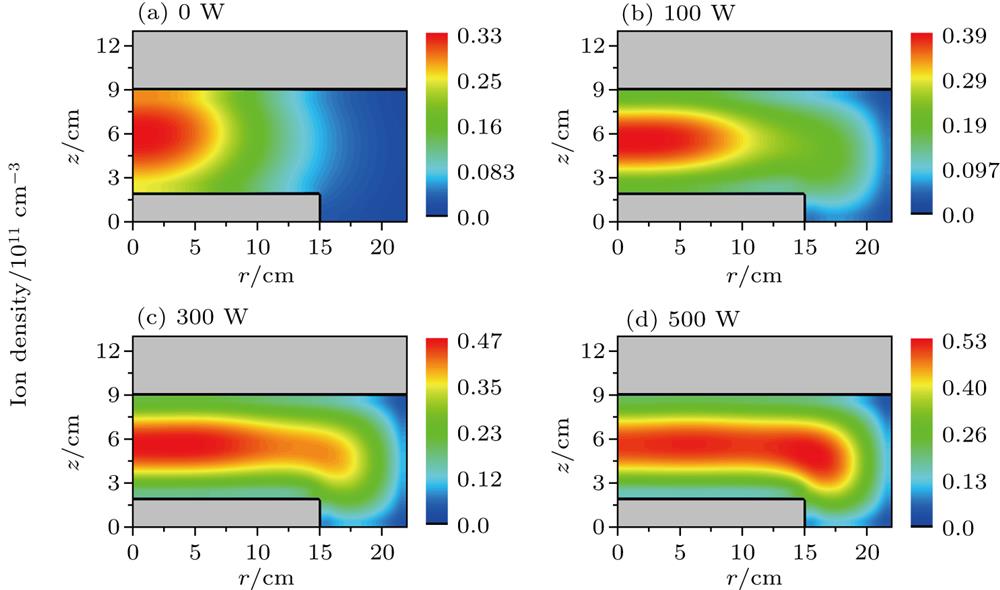
Fig. 2. Distributions of the ion density at different values of bias power: (a) 0 W, (b) 100 W, (c) 300 W, and (d) 500 W, for an argon discharge sustained at 50 W and 13.56 MHz, and bias frequency is fixed at 27.12 MHz.
Fig. 3. Distributions of ion density at different values of bias power: (a) 0 W, (b) 100 W, (c) 300 W, and (d) 500 W, for an argon discharge sustained at 100 W and 13.56 MHz, and bias frequency is fixed at 27.12 MHz.
Fig. 4. Relationship between ICP source power and peak ion density for various ratios of 27.12-MHz/2.26-MHz bias power for argon discharge maintained at 100 W and 13.56 MHz.
Fig. 5. Distributions of ion density at different ratios of 27.12-MHz/2.26-MHz bias powers: (a) 500 W/0 W, (b) 300 W/200 W, (c) 100 W/400 W, and (d) 0 W/500 W, for argon discharge maintained at 50 W and 13.56 MHz.
Fig. 6. Distributions of ion density at different ratios of 27.12-MHz/2.26-MHz bias power: (a) 500 W/0 W, (b) 300 W/200 W, (c) 100 W/400 W, and (d) 0 W/500 W, for argon discharge maintained at 100 W and 13.56 MHz.
Fig. 7. Spatiotemporal distribution of ion flux along substrate surface at different ratios of 27.12-MHz/2.26-MHz bias power: (a) 500 W/0 W, (b) 300 W/200 W, (c) 100 W/400 W, and (d) 0 W/500 W, for argon discharge maintained at 50 W and 13.56 MHz.
Fig. 8. Spatiotemporal distributions of ion flux along substrate surface at different ratios of 27.12-MHz/2.26-MHz bias power: (a) 500 W/0 W, (b) 300 W/200 W, (c) 100 W/400 W, and (d) 0 W/500 W, for argon discharge maintained at 100 W and 13.56 MHz.
Fig. 9. Radial distributions of axial ion flux at bottom electrode averaged over one cycle of 2.26-MHz frequency, which corresponds to 12 cycles of 27.12-MHz frequency at ICP source powers: (a) 50 W and (b) 100 W, for argon discharge biased by different values of 27.12-MHz/2.26-MHz bias power, and coil frequency is fixed at 13.56 MHz.
Fig. 10. Radial distributions of axial ion flux at bottom electrode averaged over one cycle for frequency of 2.26 MHz, which corresponds to 12 cycles for frequency of 27.12 MHz for different values of ICP source power in argon discharge. The 27.12-MHz/2.26-MHz bias power ratio is fixed at 200 W/300 W, and the coil frequency is set to be 13.56 MHz.


Set citation alerts for the article
Please enter your email address

© Copyright 2018-2021 | Chinese Laser Press. All Rights Reserved 沪ICP备15018463号-20