Author Affiliations
1School of Environment and Spatial Informatics, China University of Mining and Technology, Xuzhou, Jiangsu 221116,China2Bei-Stars Geospatial Information Innovation Institute, Nanjing, Jiangsu 210000,China3Space Research Centre, RMIT University, Victoria, Melbourne 3001, Australiashow less
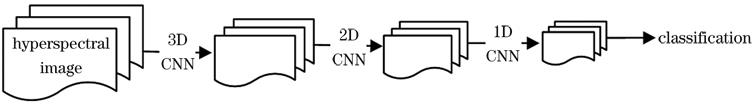
Fig. 1. Convolution calculation process of 3D-2D-1D CNN model
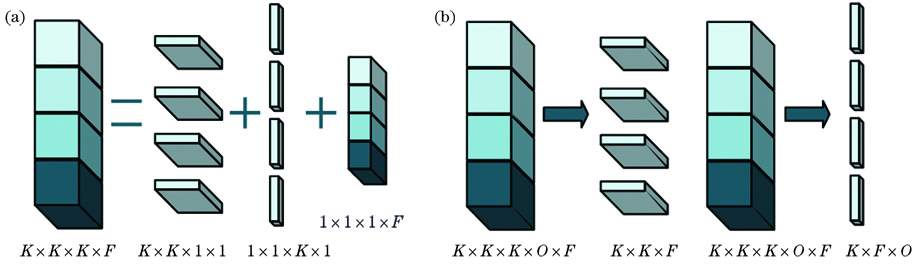
Fig. 2. Process diagrams of decomposed 3D CNN and 3D-2D-1D CNN. (a) Decomposed 3D CNN; (b) 3D-2D-1D CNN
Fig. 3. Hyperspectral data used in experiment. (a) Indian Pines; (b) Pavia University; (c) Salinas Scene; (d) WHU-Hi-Han Chuan
Fig. 4. Correlation coefficient graphs of spectral and spatial features of Indian Pines dataset. (a) Correlation coefficient of spectral features; (b) correlation coefficient of spatial features
Fig. 5. Test results of each model classification in Indian Pines dataset. (a) Ground truth; (b) SVM; (c) 2D CNN; (d) 3D CNN; (e) 3D-2D CNN; (f) 3D-2D-1D CNN
Fig. 6. Overall classification accuracy and loss of proposed model in 100 epochs. (a) Overall classification accuracy; (b) loss
| Indian Pines | Salinas Scene | WHU-Hi-Han Chuan | Pavia University |
|---|
| Class | Number of samples | Class | Number of samples | Class | Number of samples | Class | Number of samples | | Alfalfa | 46 | Brocoli green weeds 1 | 2009 | Strawberry | 44735 | Asphalt | 6631 | | Corn notill | 1428 | Brocoli green weeds 2 | 3726 | Cowpea | 22753 | Meadows | 18649 | | Corn mintill | 830 | Fallow | 1976 | Soybean | 10287 | Gravel | 2099 | | Corn | 237 | Fallow rough plow | 1394 | Sorghum | 5353 | Trees | 3064 | | Grass pasture | 483 | Fallow smooth | 2678 | Water spinach | 1200 | Shadows | 947 | | Grass trees | 730 | Stubble | 3959 | Watermelon | 4533 | Bare soil | 5029 | | Grass pasturemowed | 28 | Celery | 3579 | Greens | 5903 | Self blockingbricks | 3682 | | Hay windrowed | 478 | Grapes untrained | 11271 | Trees | 17978 | | Oats | 20 | Soil vinyard develop | 6203 | Grass | 9469 | Bitumen | 1330 | | Soybean notill | 972 | Vinyard untrained | 7268 | Red roof | 10516 | Painted metalsheets | 1345 | | Soybean mintill | 2455 | Lettuce romaine 4wk | 1068 | Gray roof | 16911 | | Soybean clean | 593 | Lettuce romaine 5wk | 1927 | Plastic | 3679 | | Wheat | 205 | Lettuce romaine 6wk | 916 | Bare soil | 9116 | | | | Woods | 1265 | Lettuce romaine 7wk | 1070 | Road | 18560 | | | | Buildings grass trees drives | 386 | Corn-senesced greenweeds | 3278 | Bright object | 1136 | | | | Stone steel towers | 93 | Vinyard vertical trellis | 1807 | Water | 75401 | | |
|
Table 1. Datasets of Indian Pines, Pavia University, Salinas Scene, and WHU-Hi-Han Chuan
| Layer (type) | Output shape | Number of parameters |
|---|
| Input_1 (Input layer) | (None, 25, 25, 30, 1) | 0 | | Conv3d (Conv3D) | (None, 23, 23, 24, 8) | 512 | | Conv3d_1 (Conv3D) | (None, 21, 21, 20, 16) | 5776 | | Reshape (Reshape) | (None, 21, 21, 320) | 0 | | Conv2d (Conv2D) | (None, 19, 19, 32) | 92192 | | Reshape_1 (Reshape) | (None, 19, 608) | 0 | | Conv1d (Conv1D) | (None, 17, 64) | 116800 | | Flatten (Flatten) | (None, 1088) | 0 | | Dense (Dense) | (None, 256) | 278784 | | Dropout (Dropout) | (None, 256) | 0 | | Dense_1 (Dense) | (None, 128) | 32896 | | Dropout_1 (Dropout) | (None, 128) | 0 | | Dense_2 (Dense) | (None, 16) | 2064 | | Total number of parameters: 5361913 |
|
Table 2. Convolution training model of Indian Pines dataset
| Dataset | Accuracy of classification | SVM | 2D CNN | 3D CNN | 3D-2D CNN | 3D-2D CNN(new) | 3D-2D-1D CNN |
|---|
| Indian Pines | OA | 69.675 | 89.560 | 96.962 | 99.331 | 94.328 | 99.652 | | AA | 51.652 | 94.443 | 97.638 | 98.141 | 93.483 | 98.974 | | KAPPA | 64.498 | 84.364 | 96.526 | 99.238 | 93.512 | 99.603 | | Pavia University | OA | 71.690 | 97.262 | 98.834 | 99.930 | 99.953 | 99.947 | | AA | 55.553 | 98.655 | 98.456 | 99.882 | 99.909 | 99.883 | | KAPPA | 57.041 | 91.957 | 98.456 | 99.907 | 99.938 | 99.929 | | Salinas Scene | OA | 93.418 | 95.238 | 99.937 | 100.000 | 100.000 | 100.000 | | AA | 96.784 | 99.993 | 99.895 | 100.000 | 100.000 | 100.000 | | KAPPA | 92.663 | 93.103 | 99.929 | 100.000 | 100.000 | 100.000 | | WHU-Hi-Han Chuan | OA | 81.575 | 99.271 | 99.917 | 99.956 | 99.953 | 99.849 | | AA | 62.336 | 98.205 | 99.800 | 99.802 | 99.872 | 99.816 | | KAPPA | 78.136 | 99.146 | 99.903 | 99.948 | 99.945 | 99.823 |
|
Table 3. Classification accuracies of each model in Indian Pines, Pavia University, Salinas Scene and WHU-Hi-Han Chuan datasets unit: %
| No. | Class | SVM | 2D CNN | 3D CNN | 3D-2D CNN | 3D-2D CNN(new) | 3D-2D-1D CNN |
|---|
| 1 | Alfalfa | 52.174 | 15.217 | 100.000 | 87.500 | 87.500 | 100.000 | | 2 | Corn notill | 84.804 | 71.919 | 96.700 | 98.500 | 90.600 | 99.600 | | 3 | Corn mintill | 73.855 | 50.723 | 81.928 | 100.000 | 87.608 | 100.000 | | 4 | Corn | 64.135 | 25.316 | 100.000 | 100.000 | 83.133 | 98.795 | | 5 | Grass pasture | 89.648 | 65.010 | 98.225 | 100.000 | 97.633 | 99.408 | | 6 | Grass trees | 96.027 | 87.945 | 99.804 | 100.000 | 99.609 | 99.609 | | 7 | Grass pasture mowed | 71.429 | 21.429 | 100.000 | 95.000 | 100.000 | 90.000 | | 8 | Hay windrowed | 89.331 | 61.088 | 100.000 | 100.000 | 100.000 | 100.000 | | 9 | Oats | 45.000 | 5.000 | 100.000 | 92.857 | 92.857 | 100.000 | | 10 | Soybean notill | 82.510 | 57.819 | 95.000 | 100.000 | 88.235 | 100.000 | | 11 | Soybean mintill | 89.939 | 84.236 | 99.767 | 99.011 | 99.651 | 99.767 | | 12 | Soybean clean | 77.572 | 45.363 | 97.831 | 98.313 | 91.807 | 99.277 | | 13 | Wheat | 97.561 | 52.195 | 100.000 | 99.301 | 98.601 | 98.601 | | 14 | Woods | 94.704 | 91.700 | 98.871 | 99.774 | 94.018 | 100.000 | | 15 | Buildings grass trees drives | 69.430 | 40.933 | 94.074 | 100.000 | 93.704 | 98.519 | | 16 | Stone steel towers | 79.570 | 50.538 | 100.000 | 100.000 | 90.769 | 100.000 |
|
Table 4. Classification accuracy of each model for each ground object sample in Indian Pines dataset unit:%
| Dataset | Classification performance | SVM | 2D CNN | 3D CNN | 3D-2D CNN | 3D-2D CNN(new) | 3D-2D-1D CNN |
|---|
| Indian Pines | Training time /s | 1.18 | 901.20 | 1477.93 | 968.71 | 642.97 | 600.77 | | Test time /s | 0.98 | 6.51 | 18.04 | 20.04 | 14.28 | 13.37 | | Pavia University | Train time /s | 2.23 | 180.28 | 953.88 | 725.11 | 564.86 | 564.32 | | Test time /s | 4.38 | 4.37 | 21.20 | 23.29 | 20.17 | 19.81 | | Salinas Scene | Train time /s | 3.41 | 572.69 | 1155.50 | 920.70 | 706.34 | 664.93 | | Test time /s | 8.34 | 5.5 | 25.93 | 29.42 | 25.43 | 22.83 | | WHU-Hi-Han Chuan | Training time /s | 678.335 | 1396.175 | 7935.224 | 5372.430 | 3410.025 | 3228.423 | | Test time /s | 862.016 | 27.298 | 148.706 | 149.471 | 129.047 | 114.472 |
|
Table 5. Training time and test time of each model in Indian Pines, Pavia University, Salinas Scene, and WHU-Hi-Han Chuan datasets