• Photonics Research
  • Vol. 9, Issue 4, 530 (2021)
Kewei Liu1, Xiaosheng Xiao2、3、*, and Changxi Yang1、4、*
Author Affiliations
  • 1State Key Laboratory of Precision Measurement Technology and Instruments, Department of Precision Instruments, Tsinghua University, Beijing 100084, China
  • 2State Key Laboratory of Information Photonics and Optical Communications, School of Electronic Engineering, Beijing University of Posts and Telecommunications, Beijing 100876, China
  • 3e-mail: xsxiao@bupt.edu.cn
  • 4e-mail: cxyang@tsinghua.edu.cn
  • show less
    DOI: 10.1364/PRJ.416523 Cite this Article Set citation alerts
    Kewei Liu, Xiaosheng Xiao, Changxi Yang. Observation of transition between multimode Q-switching and spatiotemporal mode locking[J]. Photonics Research, 2021, 9(4): 530 Copy Citation Text show less
    Schematic of the multimode fiber cavity setup. SPDM, short-pass dichroic mirror; L1 and L2, collimating lens; M, reflective mirror; HWP, half-wave plate; QWP, quarter-wave plate; PBS, polarized beam splitter; ISO, isolator; and SF, spectral filter.
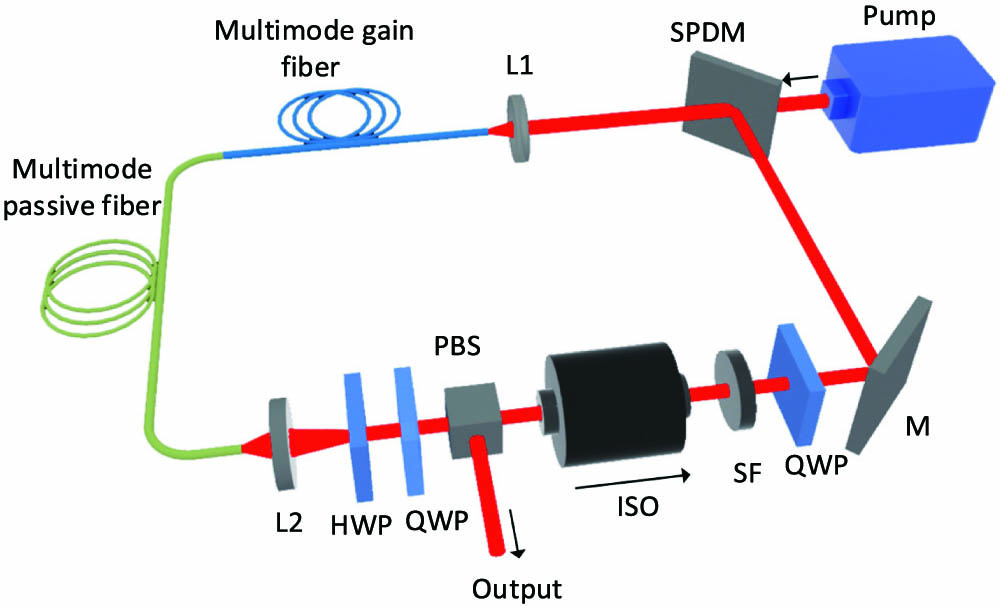
    Fig. 1. Schematic of the multimode fiber cavity setup. SPDM, short-pass dichroic mirror; L1 and L2, collimating lens; M, reflective mirror; HWP, half-wave plate; QWP, quarter-wave plate; PBS, polarized beam splitter; ISO, isolator; and SF, spectral filter.
    (a), (b) Typical steady multimode QS pulse train generated in the MMF cavity. (a) QS pulse train with a repetition of 70.14 kHz. The inset shows the corresponding pulse width of 1.88 μs. (b) Corresponding RF spectrum of the QS state (resolution bandwidth: 10 Hz). Left inset: beam profile; right inset: RF spectrum from 0 to 500 kHz. (c) QS output power and (d) repetition rate versus pump power ranging from 6.0 W to 8.0 W. Error bars in (d) shows the repetition rate variation range of the QS pulses.
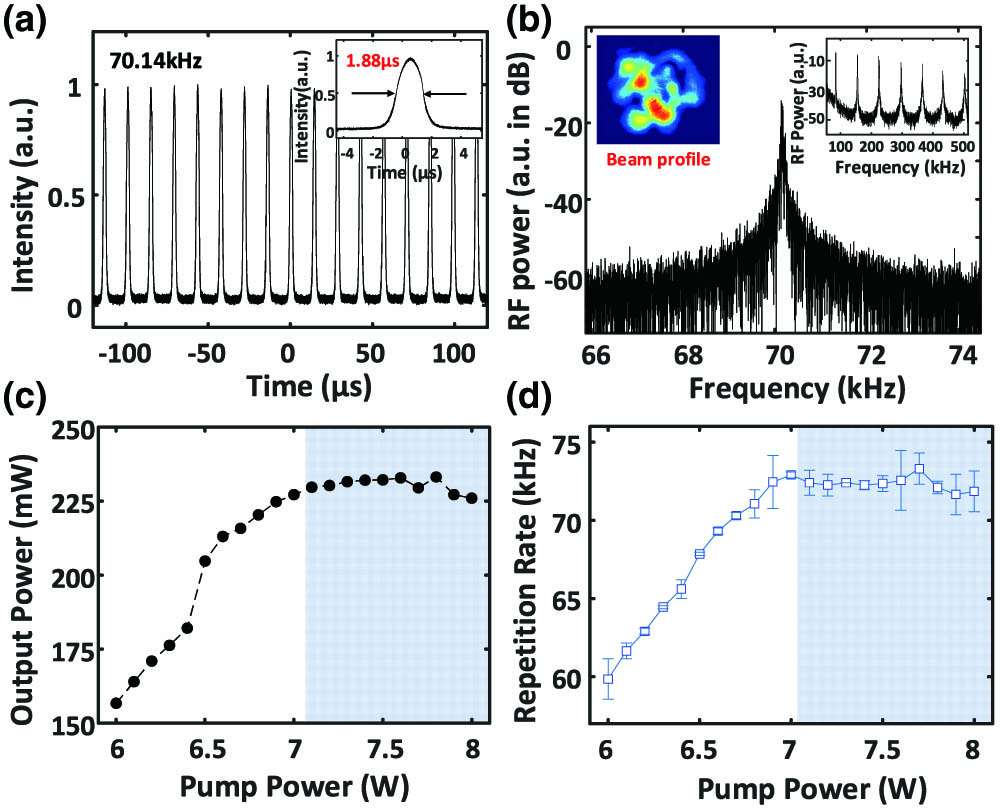
    Fig. 2. (a), (b) Typical steady multimode QS pulse train generated in the MMF cavity. (a) QS pulse train with a repetition of 70.14 kHz. The inset shows the corresponding pulse width of 1.88 μs. (b) Corresponding RF spectrum of the QS state (resolution bandwidth: 10 Hz). Left inset: beam profile; right inset: RF spectrum from 0 to 500 kHz. (c) QS output power and (d) repetition rate versus pump power ranging from 6.0 W to 8.0 W. Error bars in (d) shows the repetition rate variation range of the QS pulses.
    Characterization of the multimode QS state using (a)–(c) spatial sampling and (d), (e) spectral filtering. (a) Spectra measured at three different points of the output beam by spatial sampling, which are visualized and marked in (c). (b) Corresponding temporal signals (from top to bottom are pulse trains detected at points A, B, and C, respectively, as indicated by their colors). (d) Spectra of the filtered output beam, showing different spectral components. (e) Corresponding beam profiles of the spectral filtered output light.
    Fig. 3. Characterization of the multimode QS state using (a)–(c) spatial sampling and (d), (e) spectral filtering. (a) Spectra measured at three different points of the output beam by spatial sampling, which are visualized and marked in (c). (b) Corresponding temporal signals (from top to bottom are pulse trains detected at points A, B, and C, respectively, as indicated by their colors). (d) Spectra of the filtered output beam, showing different spectral components. (e) Corresponding beam profiles of the spectral filtered output light.
    Transition between QS and STML versus pump power changes. (a) Spectra of the laser output with increasing pump power, covering the CW, QS, and ML operating regimes. (b) Corresponding beam pattern with respect to four different pump power levels, as shown in Visualization 1. The operating regimes and the corresponding pump power are notated in the figures.
    Fig. 4. Transition between QS and STML versus pump power changes. (a) Spectra of the laser output with increasing pump power, covering the CW, QS, and ML operating regimes. (b) Corresponding beam pattern with respect to four different pump power levels, as shown in Visualization 1. The operating regimes and the corresponding pump power are notated in the figures.
    Typical multimode QS–ML bistable state, shown in Visualization 2. (a) Spectra of QS and ML states and the corresponding (b) beam profiles and (c), (d) pulse trains, with repetition rates of 66.1 kHz and 32.2 MHz, respectively.
    Fig. 5. Typical multimode QS–ML bistable state, shown in Visualization 2. (a) Spectra of QS and ML states and the corresponding (b) beam profiles and (c), (d) pulse trains, with repetition rates of 66.1 kHz and 32.2 MHz, respectively.
    Kewei Liu, Xiaosheng Xiao, Changxi Yang. Observation of transition between multimode Q-switching and spatiotemporal mode locking[J]. Photonics Research, 2021, 9(4): 530
    Download Citation