• Acta Physica Sinica
  • Vol. 68, Issue 19, 199101-1 (2019)
Tao Zhang1, Hong Hou1、*, and Ming Bao2
Author Affiliations
  • 1Key Laboratory of Ocean Acoustics and Sensing, Ministry of Industry and Information Technology, School of Marine Science and Technology, Northwestern Polytechnical University, Xi’an 710072, China
  • 2Key Laboratory of Noise and Vibration Research, Chinese Academy of Sciences, Beijing 100190, China
  • show less
    DOI: 10.7498/aps.68.20190831 Cite this Article
    Tao Zhang, Hong Hou, Ming Bao. Imaging through coda wave interferometryvia sparse reconstruction[J]. Acta Physica Sinica, 2019, 68(19): 199101-1 Copy Citation Text show less
    Comparison between typical time traces of a wave propagating in a multiple scattering medium before and after a small perturbation: (a) The first arrival waves before and after a small perturbation; (b) the coda waves before and after a small perturbation.多散射介质中扰动前后波形的比较 (a) 直达波扰动前后的波形; (b)尾波扰动前后的波形
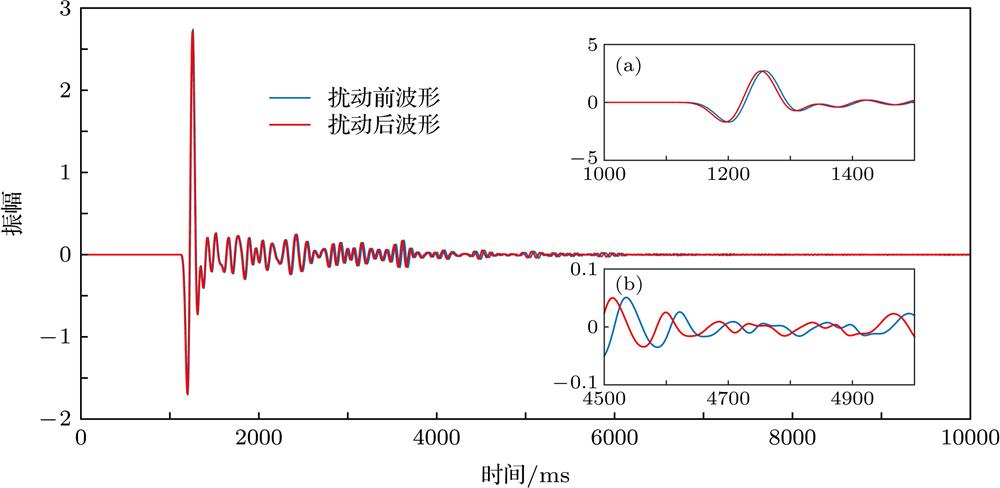
    Fig. 1. Comparison between typical time traces of a wave propagating in a multiple scattering medium before and after a small perturbation: (a) The first arrival waves before and after a small perturbation; (b) the coda waves before and after a small perturbation.多散射介质中扰动前后波形的比较 (a) 直达波扰动前后的波形; (b)尾波扰动前后的波形
    Examples of sensitivity kernel based on the diffusion approximation in 2-D: (a) Spatial representation of the sensitivity kernel when t = 1 s; (b) spatial representation of the sensitivity kernel when t = 5 s; (c) vertical view of the sensitivity kernel when t = 1 s; (d) vertical view of the sensitivity kernel when t = 5 s.基于扩散近似的二维敏感核示例 (a) t = 1 s时的敏感核空间分布; (b) t = 5 s时的敏感核空间分布; (c) t = 1 s时的敏感核俯视图; (d) t = 5 s时的敏感核俯视图
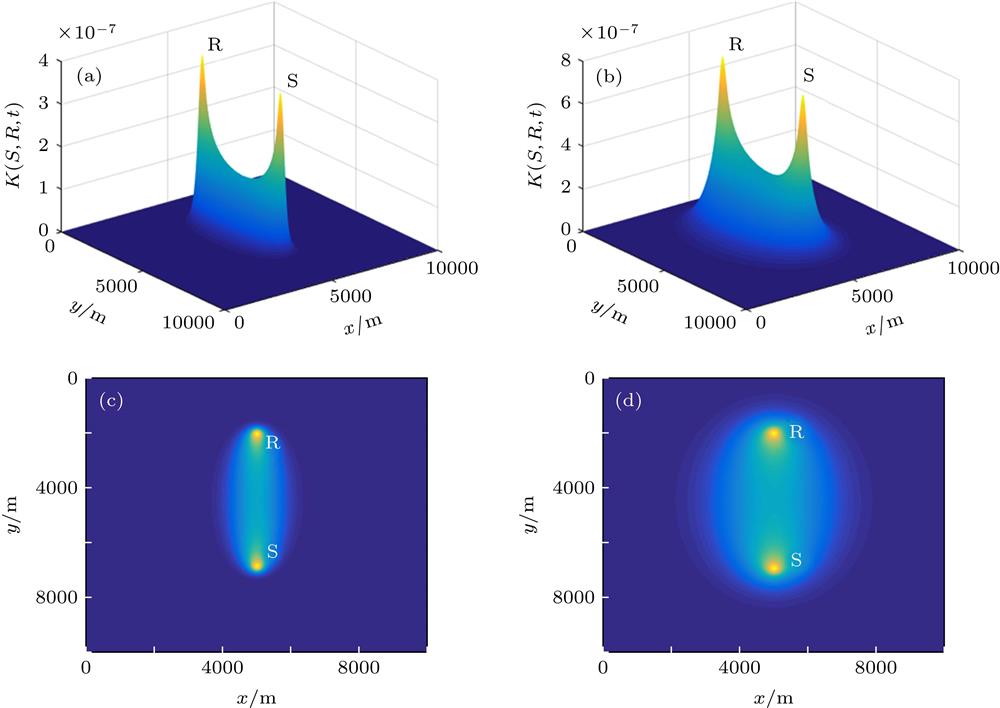
    Fig. 2. Examples of sensitivity kernel based on the diffusion approximation in 2-D: (a) Spatial representation of the sensitivity kernel when t = 1 s; (b) spatial representation of the sensitivity kernel when t = 5 s; (c) vertical view of the sensitivity kernel when t = 1 s; (d) vertical view of the sensitivity kernel when t = 5 s. 基于扩散近似的二维敏感核示例 (a) t = 1 s时的敏感核空间分布; (b) t = 5 s时的敏感核空间分布; (c) t = 1 s时的敏感核俯视图; (d) t = 5 s时的敏感核俯视图
    2-D velocity field model.二维速度场模型
    Fig. 3. 2-D velocity field model.二维速度场模型
    Layout of the source and receivers.激励源及接收点布设
    Fig. 4. Layout of the source and receivers.激励源及接收点布设
    Case 1: (a) Inversion image of linear least squares method; (b) inversion image of the method in this paper.算例1 (a) 线性最小二乘法的反演图像; (b) 本文方法的反演图像
    Fig. 5. Case 1: (a) Inversion image of linear least squares method; (b) inversion image of the method in this paper.算例1 (a) 线性最小二乘法的反演图像; (b) 本文方法的反演图像
    Case 2: (a) Inversion image of linear least squares method; (b) inversion image of the method in this paper.算例2 (a) 线性最小二乘法的反演图像; (b) 本文方法的反演图像
    Fig. 6. Case 2: (a) Inversion image of linear least squares method; (b) inversion image of the method in this paper.算例2 (a) 线性最小二乘法的反演图像; (b) 本文方法的反演图像
    The results of experimental data processing: (a) Inversion image of linear least squares method; (b)inversion image of the method in this paper.实验数据处理结果 (a) 线性最小二乘法的反演图像; (b) 本文方法的反演图像
    Fig. 7. The results of experimental data processing: (a) Inversion image of linear least squares method; (b)inversion image of the method in this paper.实验数据处理结果 (a) 线性最小二乘法的反演图像; (b) 本文方法的反演图像
    Case 3: (a) Inversion image of linear least squares method; (b) inversion image of the method in this paper.算例3 (a) 线性最小二乘法的反演图像; (b) 本文方法的反演图像
    Fig. 8. Case 3: (a) Inversion image of linear least squares method; (b) inversion image of the method in this paper.算例3 (a) 线性最小二乘法的反演图像; (b) 本文方法的反演图像
    Case 4: (a) Inversion image of linear least squares method; (b) inversion image of the method in this paper.算例4 (a) 线性最小二乘法的反演图像; (b) 本文方法的反演图像
    Fig. 9. Case 4: (a) Inversion image of linear least squares method; (b) inversion image of the method in this paper.算例4 (a) 线性最小二乘法的反演图像; (b) 本文方法的反演图像
    Case 5: (a) Inversion image of linear least squares method; (b) inversion image of the method in this paper.算例5 (a) 线性最小二乘法的反演图像; (b) 本文方法的反演图像
    Fig. 10. Case 5: (a) Inversion image of linear least squares method; (b) inversion image of the method in this paper.算例5 (a) 线性最小二乘法的反演图像; (b) 本文方法的反演图像
    反演成像方法成像时间/s
    算例1算例2算例3算例4算例5
    线性最小二乘法1.5848501.7935171.6012761.6709322.278217
    本文方法0.2648940.2985830.2535110.2689690.115788
    Table 1. The comparison of imaging time between linear least squares method and the method in this paper.
    Tao Zhang, Hong Hou, Ming Bao. Imaging through coda wave interferometryvia sparse reconstruction[J]. Acta Physica Sinica, 2019, 68(19): 199101-1
    Download Citation