
Yan YANG, Jinlong ZHANG, Xiaozhen LIANG. End-to-end Image Dehazing Based on Ladder Network and Cross Fusion[J]. Acta Photonica Sinica, 2022, 51(2): 0210004
- Acta Photonica Sinica
- Vol. 51, Issue 2, 0210004 (2022)
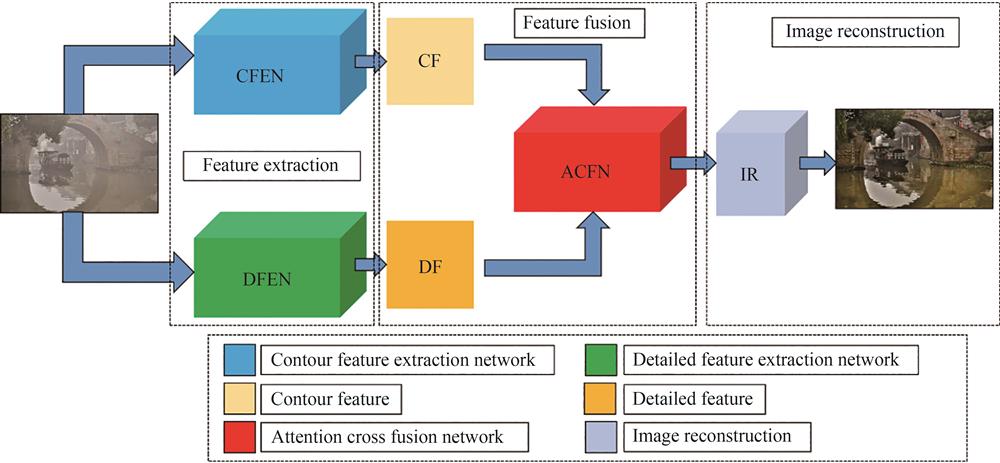
Fig. 1. The network structure of this article
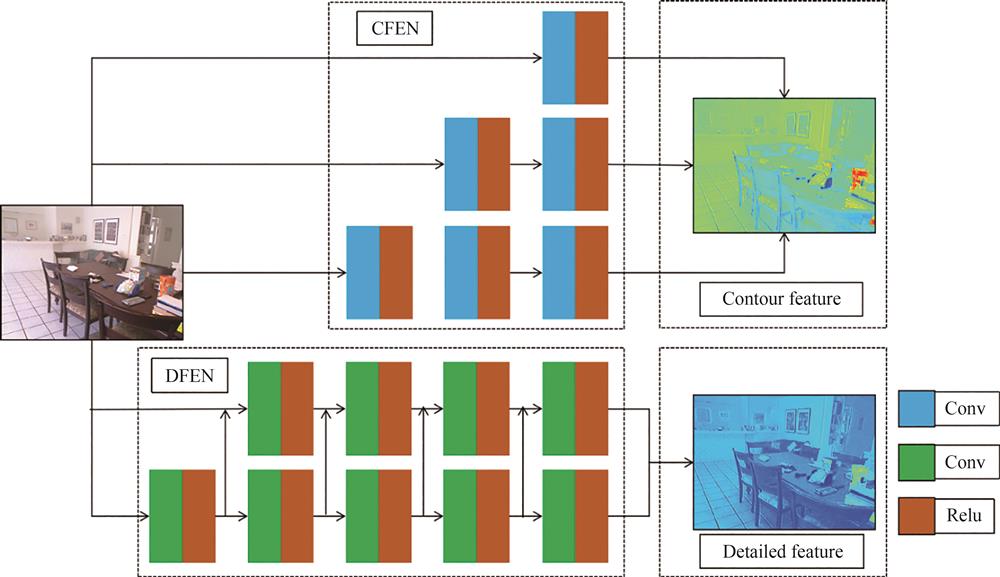
Fig. 2. Feature extraction network
Fig. 3. Hazy image and its feature map
Fig. 4. Attention cross fusion module
Fig. 5. Image reconstruction
Fig. 6. Real hazy image feature and restoration schematic diagram
Fig. 7. Experimental results of real hazy images
Fig. 8. Experimental results of the Reside dataset
Fig. 9. Experimental results of the NYU dataset
Fig. 10. Experimental results of the Middlebury dataset
Fig. 11. Partial enlarged schematic
Fig. 12. Comparison of ablation experiments
|
Table 1. Comparison of real hazy image indicators of various algorithms
|
Table 2. RESIDE test set indicators of every algorithm
|
Table 3. NYU test set indicators of every algorithm
|
Table 4. Middlebury test set indicators of every algorithm
|
Table 5. Objective indicators of ablation experiment

Set citation alerts for the article
Please enter your email address
© Copyright 2018-2021 | Chinese Laser Press. All Rights Reserved 沪ICP备15018463号-20