• Chinese Optics Letters
  • Vol. 14, Issue 7, 071403 (2016)
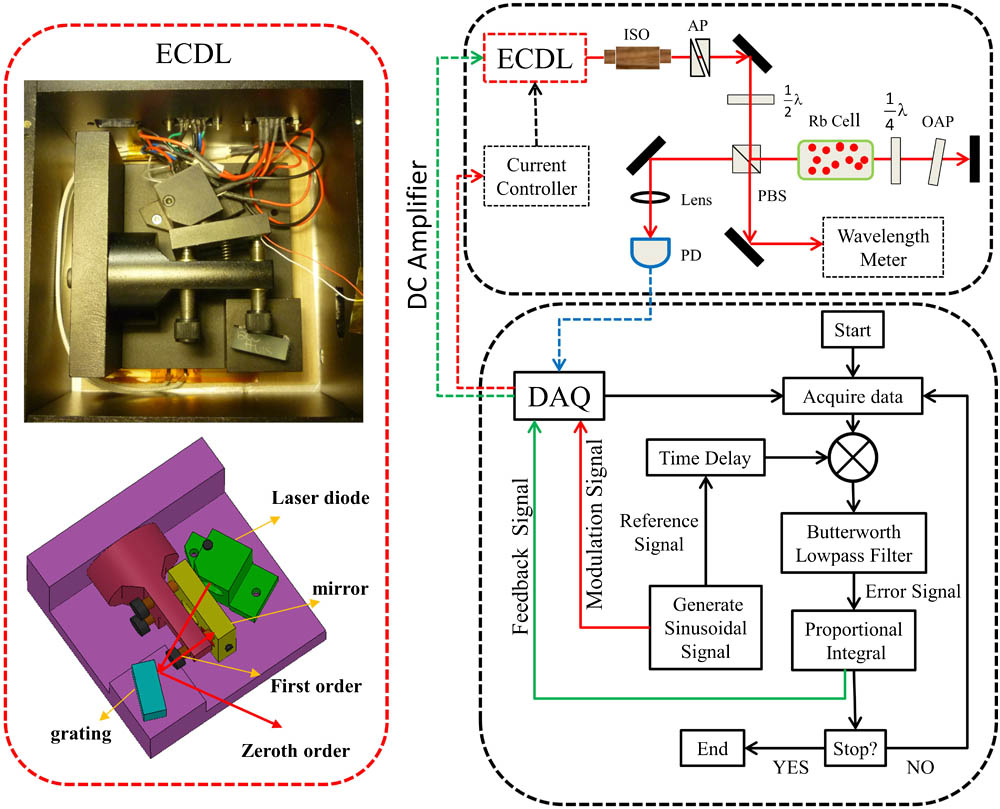
Xiuxiu Yang, Yanning Yin, Xingjia Li, Supeng Xu, Yong Xia*, and Jianping Yin
Author Affiliations
  • State Key Laboratory of Precision Spectroscopy, Department of Physics, East China Normal University, Shanghai 200062, China
  • show less
    DOI: 10.3788/COL201614.071403 Cite this Article Set citation alerts
    Xiuxiu Yang, Yanning Yin, Xingjia Li, Supeng Xu, Yong Xia, Jianping Yin. External cavity diode laser as a stable-frequency light source for application in laser cooling of molecules[J]. Chinese Optics Letters, 2016, 14(7): 071403 Copy Citation Text show less
    Left, mechanical structure of our Littman cavity ECDL. Right, experiment setup for saturated absorption spectroscopy (at the top right) and the flow chart of the laser frequency stabilization (at the bottom right) all based on the LabVIEW program. ISO: optical isolator; AP: anamorphic prisms; λ/2: half-wave plate; λ/4: quarter-wave plate; OAP: optical attenuation piece; PD: photodetector; PBS: polarization beam splitter.
    Fig. 1. Left, mechanical structure of our Littman cavity ECDL. Right, experiment setup for saturated absorption spectroscopy (at the top right) and the flow chart of the laser frequency stabilization (at the bottom right) all based on the LabVIEW program. ISO: optical isolator; AP: anamorphic prisms; λ/2: half-wave plate; λ/4: quarter-wave plate; OAP: optical attenuation piece; PD: photodetector; PBS: polarization beam splitter.
    (a) Saturated absorption spectroscopy of Rb D2 lines acquired based on the LabVIEW program. (b) The error signal with respect to one peak of Rb85D2 lines. (c) and (d) The error signal and the laser frequency as a function of the PZT scan voltage with a slope of 3.57×10⁻⁴/V and 25 MHz/V, respectively; the points show the original data and the lines are linear fitted curves to the data.
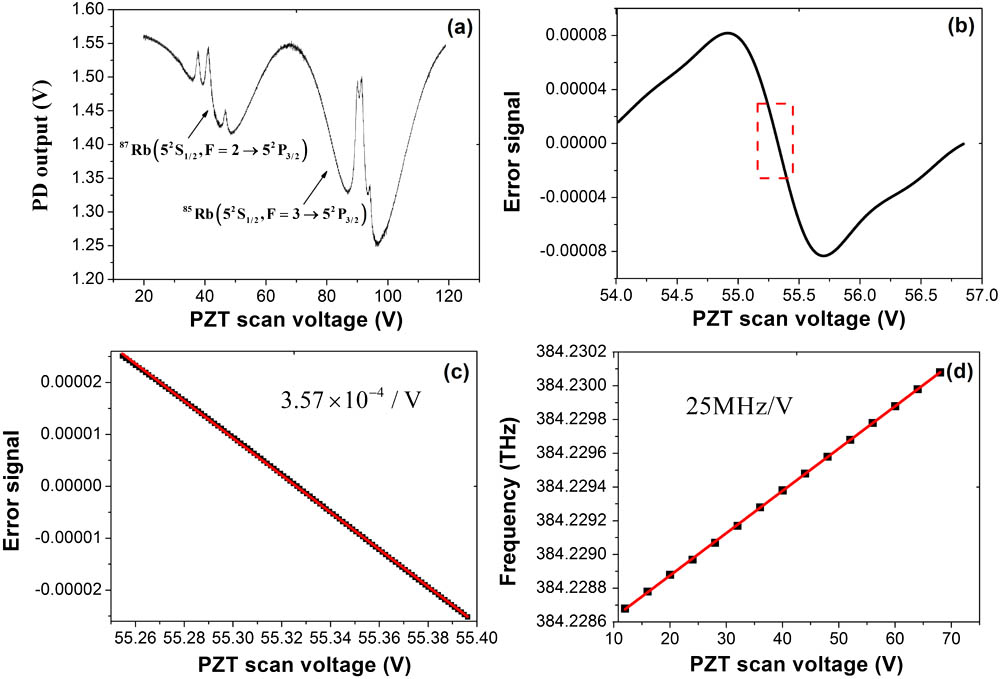
    Fig. 2. (a) Saturated absorption spectroscopy of Rb D2 lines acquired based on the LabVIEW program. (b) The error signal with respect to one peak of Rb85D2 lines. (c) and (d) The error signal and the laser frequency as a function of the PZT scan voltage with a slope of 3.57×10⁴/V and 25 MHz/V, respectively; the points show the original data and the lines are linear fitted curves to the data.
    (a) Error signal sampled for 10 hours. (b) The Gaussian fitted curve to the statistical frequency counts of the error signal samples. (c) The feedback voltage of the PZT via time to show the frequency shift. (d) Frequency stability (Allan standard deviation) of the frequency-stabilized ECDL.
    Fig. 3. (a) Error signal sampled for 10 hours. (b) The Gaussian fitted curve to the statistical frequency counts of the error signal samples. (c) The feedback voltage of the PZT via time to show the frequency shift. (d) Frequency stability (Allan standard deviation) of the frequency-stabilized ECDL.
    Experimental setup for Ti:sapphire (Ti:S) laser stabilization.
    Fig. 4. Experimental setup for Ti:sapphire (Ti:S) laser stabilization.
    Frequency of the beat note in more than one h, recorded using a frequency counter with an integration time of 100 ms. The Gaussian fitted curve indicates a frequency stability of ±2.5 MHz.
    Fig. 5. Frequency of the beat note in more than one h, recorded using a frequency counter with an integration time of 100 ms. The Gaussian fitted curve indicates a frequency stability of ±2.5MHz.
    Xiuxiu Yang, Yanning Yin, Xingjia Li, Supeng Xu, Yong Xia, Jianping Yin. External cavity diode laser as a stable-frequency light source for application in laser cooling of molecules[J]. Chinese Optics Letters, 2016, 14(7): 071403
    Download Citation