• Photonics Research
  • Vol. 12, Issue 5, 947 (2024)
Duc Le1,*, Anni Ranta-Lassila1, Teemu Sipola1, Mikko Karppinen1..., Jarno Petäjä1, Minna Kehusmaa1, Sanna Aikio1, Tian-Long Guo2, Matthieu Roussey2, Jussi Hiltunen1 and Alexey Popov1|Show fewer author(s)
Author Affiliations
  • 1VTT Technical Research Centre of Finland, 90570 Oulu, Finland
  • 2Department of Physics and Mathematics, University of Eastern Finland, FI-80101 Joensuu, Finland
  • show less
    DOI: 10.1364/PRJ.517895 Cite this Article Set citation alerts
    Duc Le, Anni Ranta-Lassila, Teemu Sipola, Mikko Karppinen, Jarno Petäjä, Minna Kehusmaa, Sanna Aikio, Tian-Long Guo, Matthieu Roussey, Jussi Hiltunen, Alexey Popov, "High-performance portable grating-based surface plasmon resonance sensor using a tunable laser at normal incidence," Photonics Res. 12, 947 (2024) Copy Citation Text show less
    (a) 3D illustration of the gold grating-based SPR sensor with an emphasis on the cross section of a unit cell of the grating (periodicity along x axis), considering invariance in the z direction. (b) 2D finite element method model of a unit cell using periodic conditions for optimizing the grating configuration. A thickness of 3 μm of water with RI of 1.318 was considered above the grating.
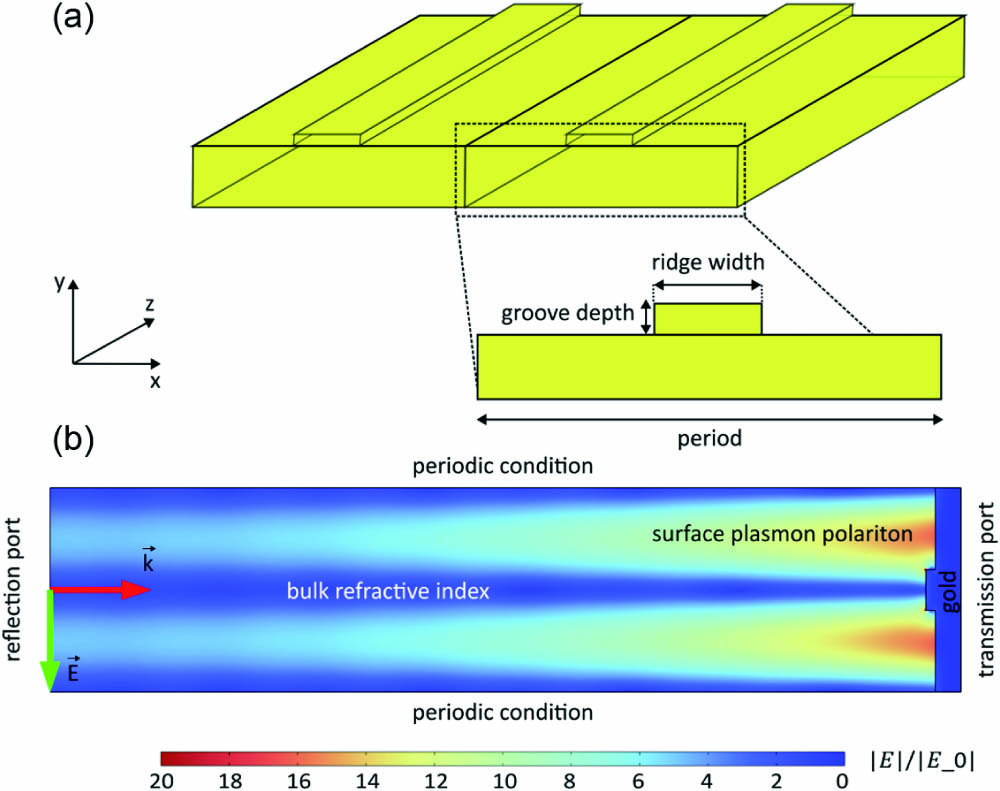
    Fig. 1. (a) 3D illustration of the gold grating-based SPR sensor with an emphasis on the cross section of a unit cell of the grating (periodicity along x axis), considering invariance in the z direction. (b) 2D finite element method model of a unit cell using periodic conditions for optimizing the grating configuration. A thickness of 3 μm of water with RI of 1.318 was considered above the grating.
    Computational SPP coupling efficiency of different grating configurations covered by water (RI=1.318) illuminated under normal incidence. (a) Grating with a groove depth of 50 nm and a varying duty cycle. (b)–(d) Gratings with a varying groove depth and a duty cycle of (b) 20%, (c) 50%, and (d) 80%.
    Fig. 2. Computational SPP coupling efficiency of different grating configurations covered by water (RI=1.318) illuminated under normal incidence. (a) Grating with a groove depth of 50 nm and a varying duty cycle. (b)–(d) Gratings with a varying groove depth and a duty cycle of (b) 20%, (c) 50%, and (d) 80%.
    SEM images of the fabricated silicon masters (left) and the gold-coated replicates (right). (a), (b) Sensor 1 with a designed duty cycle of 20%. The measured duty cycle of gold-coated replicate of Sensor 1 was 25%. (c), (d) Sensor 2 with a designed duty cycle of 50%. The measured duty cycle of gold-coated replicate of Sensor 2 was 52%.
    Fig. 3. SEM images of the fabricated silicon masters (left) and the gold-coated replicates (right). (a), (b) Sensor 1 with a designed duty cycle of 20%. The measured duty cycle of gold-coated replicate of Sensor 1 was 25%. (c), (d) Sensor 2 with a designed duty cycle of 50%. The measured duty cycle of gold-coated replicate of Sensor 2 was 52%.
    Fabrication tolerance analysis. (a) Computational SPP coupling efficiency of gold-coated replicate with a slanted angle α varying from 0° to 70°. The inset compares bulk gold and gold-coated replicated models with a rectangular profile. The spectra were spline-smoothened with a wavelength step of 0.1 nm in MATLAB. (b) (Left axis) SPR wavelength shift of slanted gratings in comparison with perpendicular grating (0°). (Right red axis) FWHM of SPR dip as a function of slanted angle.
    Fig. 4. Fabrication tolerance analysis. (a) Computational SPP coupling efficiency of gold-coated replicate with a slanted angle α varying from 0° to 70°. The inset compares bulk gold and gold-coated replicated models with a rectangular profile. The spectra were spline-smoothened with a wavelength step of 0.1 nm in MATLAB. (b) (Left axis) SPR wavelength shift of slanted gratings in comparison with perpendicular grating (0°). (Right red axis) FWHM of SPR dip as a function of slanted angle.
    Computational SPP coupling efficiency of grating with a groove depth of 50 nm and a varying duty cycle in water (RI=1.318) at small nonzero incidences: (a) 0.1° and (b) 0.3°.
    Fig. 5. Computational SPP coupling efficiency of grating with a groove depth of 50 nm and a varying duty cycle in water (RI=1.318) at small nonzero incidences: (a) 0.1° and (b) 0.3°.
    Computational SPP coupling efficiency at higher incidence angles on gratings in water (RI=1.318) with a groove depth of 50 nm and (a) duty cycle of 20% and (b) duty cycle of 50%.
    Fig. 6. Computational SPP coupling efficiency at higher incidence angles on gratings in water (RI=1.318) with a groove depth of 50 nm and (a) duty cycle of 20% and (b) duty cycle of 50%.
    (a) Schematic of the optical setup for characterizing the fabricated SPR sensors. (b) Spectrum of the tunable laser operating at 1550-nm wavelength measured by the used NIR spectrometer. The FWHM of the fit curve is 6 nm, which was caused by the spectral resolution of the NIR spectrometer.
    Fig. 7. (a) Schematic of the optical setup for characterizing the fabricated SPR sensors. (b) Spectrum of the tunable laser operating at 1550-nm wavelength measured by the used NIR spectrometer. The FWHM of the fit curve is 6 nm, which was caused by the spectral resolution of the NIR spectrometer.
    Experimental observation of SPR mode splitting in water (RI=1.318). Experimental reflectance spectra of (a) Sensor 1 with a measured duty cycle of 25% and (b) Sensor 2 with a measured duty cycle of 52%. The reflectance was calculated by the ratio between TM and TE modes.
    Fig. 8. Experimental observation of SPR mode splitting in water (RI=1.318). Experimental reflectance spectra of (a) Sensor 1 with a measured duty cycle of 25% and (b) Sensor 2 with a measured duty cycle of 52%. The reflectance was calculated by the ratio between TM and TE modes.
    Experimental setup using a tunable laser at normal incidence. (a) and (b) Top view and side view of the experimental setup, respectively. (c) Schematic of the optical path. (d) Image of the SPR sensor covered with an AR glass on a sample holder.
    Fig. 9. Experimental setup using a tunable laser at normal incidence. (a) and (b) Top view and side view of the experimental setup, respectively. (c) Schematic of the optical path. (d) Image of the SPR sensor covered with an AR glass on a sample holder.
    Characterization of Sensor 1. (a) Comparison between simulation and experiment of reflectance spectrum. (b) Comparison between the simulation and experiment of SPR dip shift as a function of RI change of glucose solution. The labeling value is the mass fraction (in kg/kg). The experimental sensitivity was determined by the slope of the linear fit applied to the experimental data. Each concentration was measured three times.
    Fig. 10. Characterization of Sensor 1. (a) Comparison between simulation and experiment of reflectance spectrum. (b) Comparison between the simulation and experiment of SPR dip shift as a function of RI change of glucose solution. The labeling value is the mass fraction (in kg/kg). The experimental sensitivity was determined by the slope of the linear fit applied to the experimental data. Each concentration was measured three times.
    Low-concentration detection. Reflectance spectra with a tuning range of 5 nm and a tuning step of 0.1 nm of (a) glucose and (b) creatinine solutions at different low concentrations. SPR dip as a function of the concentration of (c) glucose and (d) creatinine solutions in water. Each concentration was measured three times.
    Fig. 11. Low-concentration detection. Reflectance spectra with a tuning range of 5 nm and a tuning step of 0.1 nm of (a) glucose and (b) creatinine solutions at different low concentrations. SPR dip as a function of the concentration of (c) glucose and (d) creatinine solutions in water. Each concentration was measured three times.
    Tunable laser stability. (a) Tuning range from 1528 nm to 1565 nm with a tuning step of 1 nm. (b) Tuning range from 1533.5 nm to 1538.5 nm with a tuning step of 0.1 nm. The tuning speed was 15 s per wavelength.
    Fig. 12. Tunable laser stability. (a) Tuning range from 1528 nm to 1565 nm with a tuning step of 1 nm. (b) Tuning range from 1533.5 nm to 1538.5 nm with a tuning step of 0.1 nm. The tuning speed was 15 s per wavelength.
    Mass Fraction (kg/kg)RI Change
    0.000.0000
    0.050.0073
    0.100.0150
    0.150.0233
    Table 1. Measured RI Change of Glucose Solutions at 589 nm at Room Temperature
    ReferencesSensitivity (nm/RIU)FOMResonance Wavelength (nm)
    Lopez-Munoz et al. [46]425.035.0525–750
    Cao et al. [38]686.821.0750–800
    Long et al. [30]1477.735.2850–900
    Sun et al. [47]637.021.2650–700
    This work1101.6229.51528–1656
    Table 2. Comparison of the Performance of Our Sensor with Other Grating-Based SPR Sensors Reported in the Literature
    Duc Le, Anni Ranta-Lassila, Teemu Sipola, Mikko Karppinen, Jarno Petäjä, Minna Kehusmaa, Sanna Aikio, Tian-Long Guo, Matthieu Roussey, Jussi Hiltunen, Alexey Popov, "High-performance portable grating-based surface plasmon resonance sensor using a tunable laser at normal incidence," Photonics Res. 12, 947 (2024)
    Download Citation