Author Affiliations
1State Key Laboratory of Integrated Service Networks, Xidian University, Xi’an 710071, China2School of Physics and Optoelectronic Engineering, Xidian University, Xi’an 710071, China3School of Electronic Engineering, Xidian University, Xi’an 710071, Chinashow less
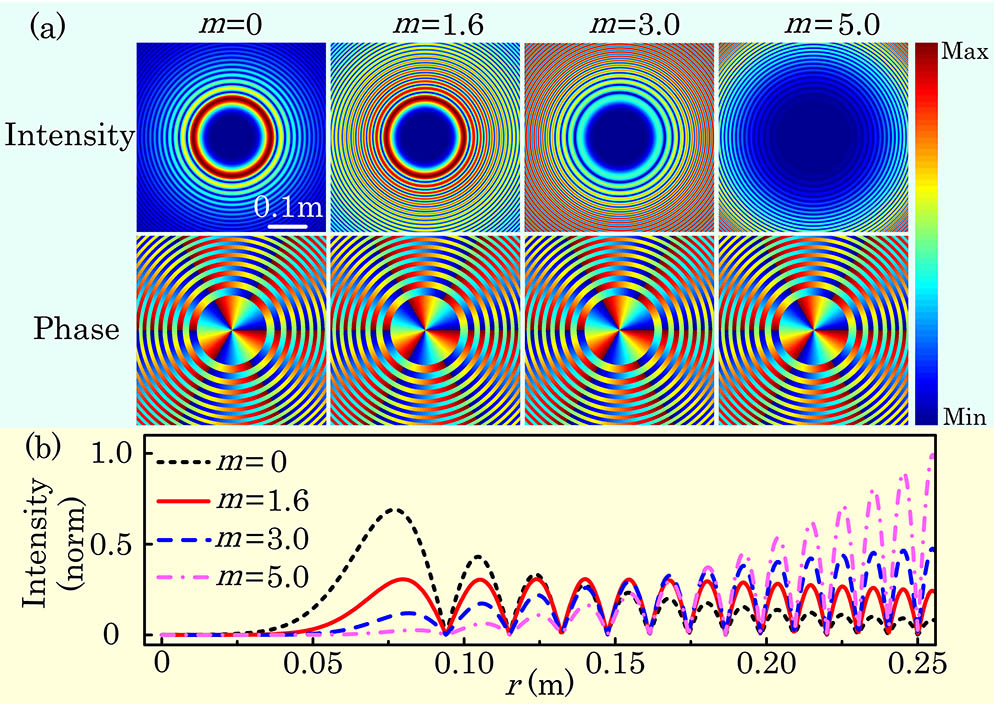
Fig. 1. (a) Intensity and phase distributions of AAVBs for different values of , 1.6, 3, and 5 at the incident plane. (b) Normalized radial intensity plots of (a) in black, red, blue, and purple colors.
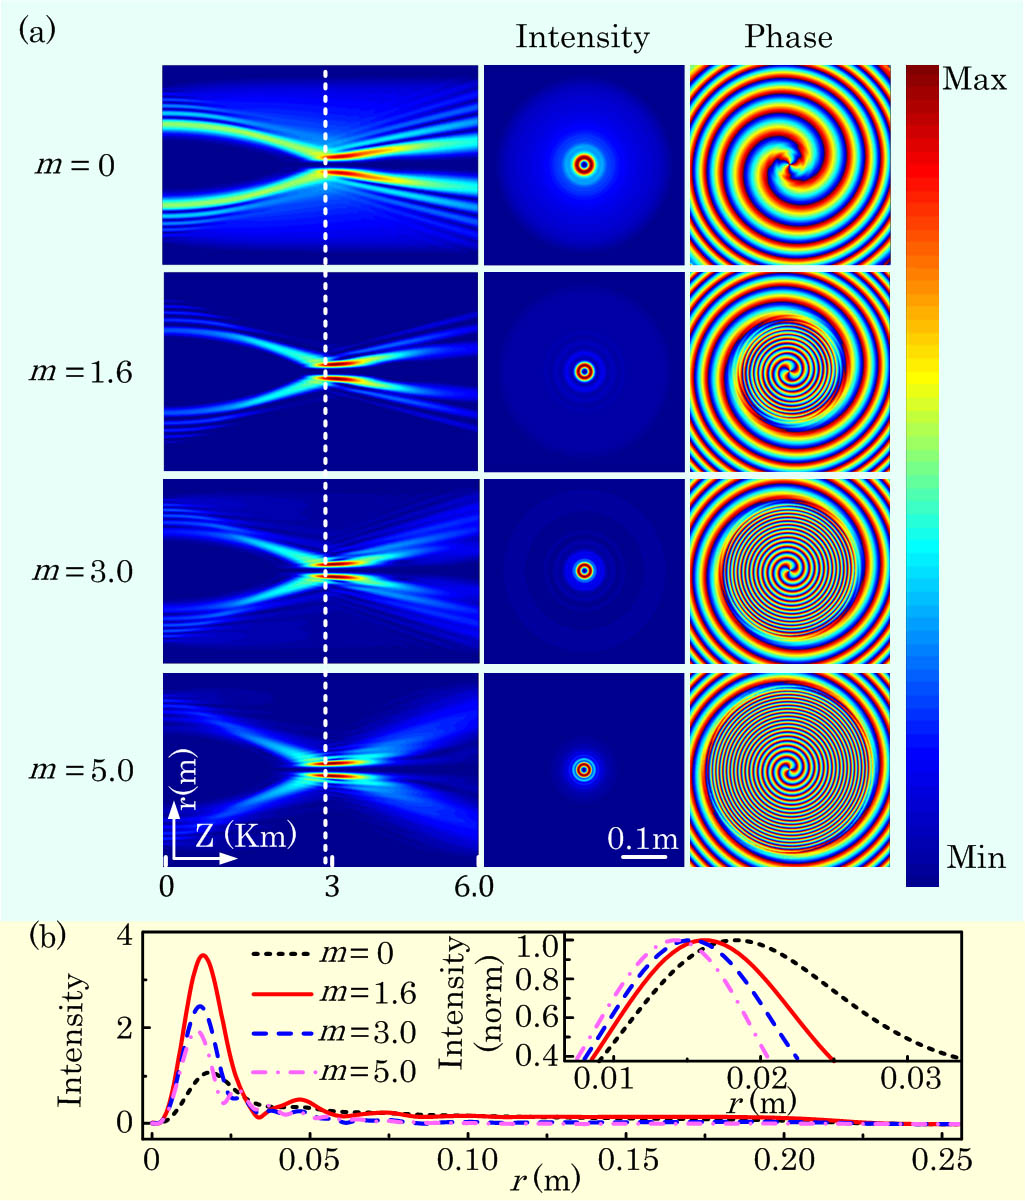
Fig. 2. (a) Free propagating AAVBs with , 1.6, 3, and 5. The side-views of AAVB propagation are given in the first column, and the focal planes are marked by the dashed line. The intensity and phase distributions of AAVBs at the focal plane are given in the second and third columns, respectively. (b) Radial intensity plots of AAVBs at the focal plane in colors. The inset shows normalized intensities, amplifying variations in the radii of the primary rings.
Fig. 3. Multiple random phase screen model.
Fig. 4. (a)–(d) Intensity distributions of AAVBs with for different values of , 1.6, 3, and 5 after propagation through a turbulent optical channel. (e)–(h) Phase cross-sections of AAVBs corresponding to (a)–(d), respectively. Insets are magnified representations of vortex splitting corresponding to the regions marked by the dashed squares, where phase and intensity patterns of each charge-one vortex are indicated by the overlaid white circles and white dotted circles, respectively.
Fig. 5. Plots of vortex splitting ratio (V) as a function of turbulence strength () for (a) and (b) .
Parameter | Value |
---|
Wavelength () | 1550 nm | Transverse scales () | 0.012 m | Truncation factor () | 0.1 | Grid numbers () | | Sample grid length | | Number of phase screen | 50 | Turbulence strength () | Varies from 0.96 to 6.6 | Inner scale size | 0.001 m | Outer scale size | 10 m for and 1 m for |
|
Table 1. Values of Parameters Used in the Simulations