• Chinese Optics Letters
  • Vol. 21, Issue 2, 021602 (2023)
Weiyi Yin1, Juan Song2, Xiangyu Ren1, Qian Yao1, Xian Lin1, and Ye Dai1、*
Author Affiliations
  • 1Department of Physics, Shanghai University, Shanghai 200444, China
  • 2School of Material Science and Engineering, Jiangsu University, Zhenjiang 212013, China
  • show less
    DOI: 10.3788/COL202321.021602 Cite this Article Set citation alerts
    Weiyi Yin, Juan Song, Xiangyu Ren, Qian Yao, Xian Lin, Ye Dai. Nonlinear ionization control by temporally shaped fs+ps double-pulse sequence on ZnO[J]. Chinese Optics Letters, 2023, 21(2): 021602 Copy Citation Text show less
    (a) Schematic diagram of experimental setup based on a Mach–Zehnder-like apparatus. M, mirror; BS, beam splitter; HRF, horizontal retroreflector; VRF, vertical retroreflector. (b) Spatial light intensity distributions of fs pulse. (c) Spatial light intensity distributions of temporally shaped ps pulse. The scale bar is 3 mm. (d) Schematic diagram of temporal delays between two sub-pulses.
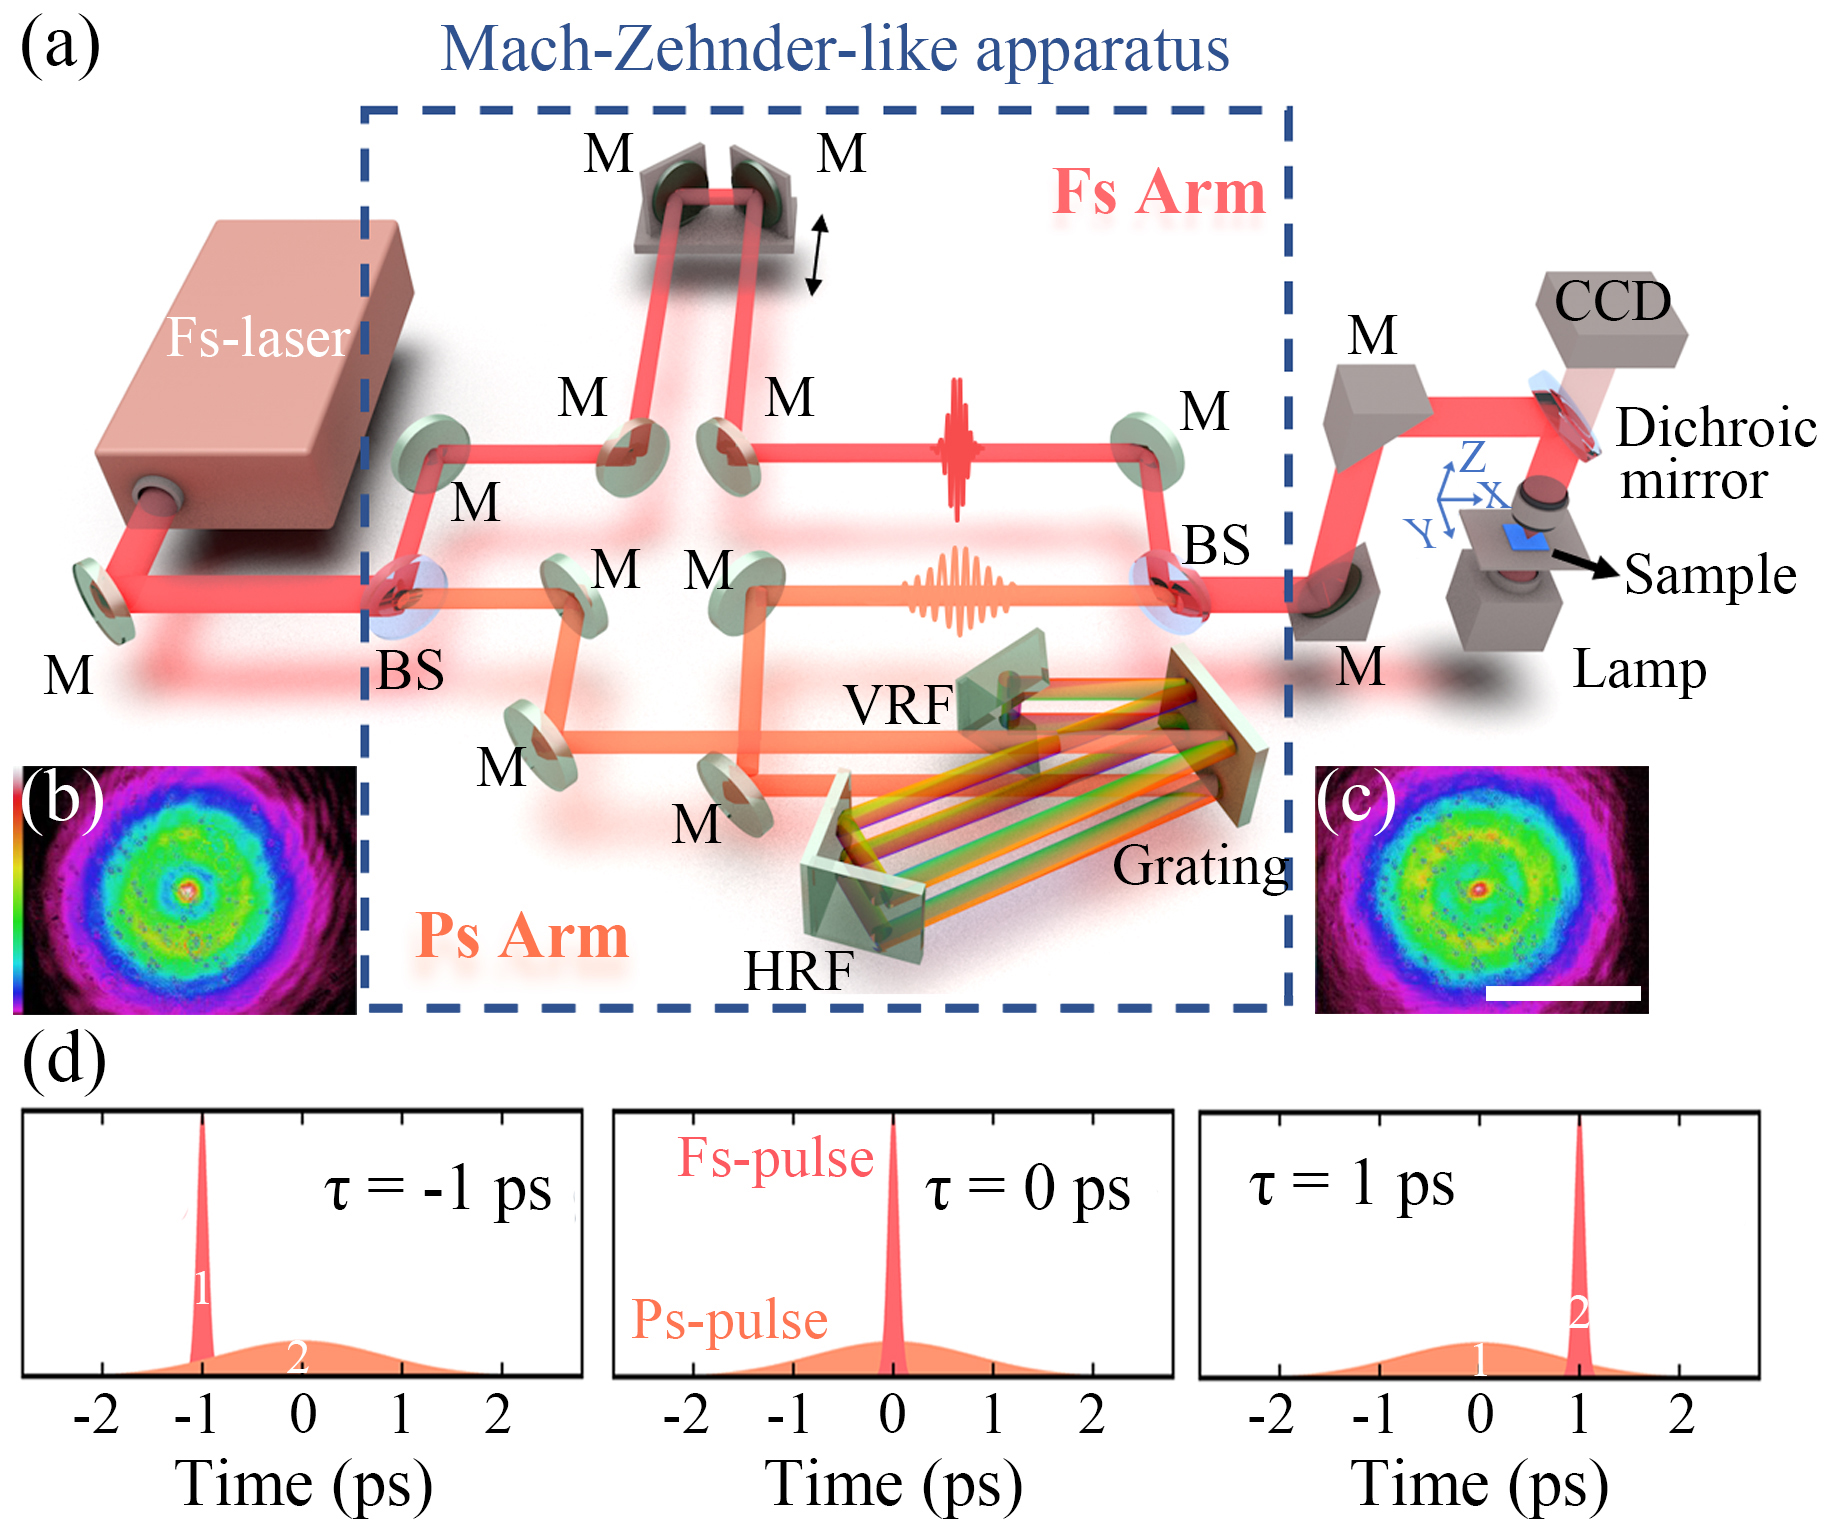
    Fig. 1. (a) Schematic diagram of experimental setup based on a Mach–Zehnder-like apparatus. M, mirror; BS, beam splitter; HRF, horizontal retroreflector; VRF, vertical retroreflector. (b) Spatial light intensity distributions of fs pulse. (c) Spatial light intensity distributions of temporally shaped ps pulse. The scale bar is 3 mm. (d) Schematic diagram of temporal delays between two sub-pulses.
    Induced ripple areas over the delay times. The markers in two curves correspond to different color blocks for the SEM insets.
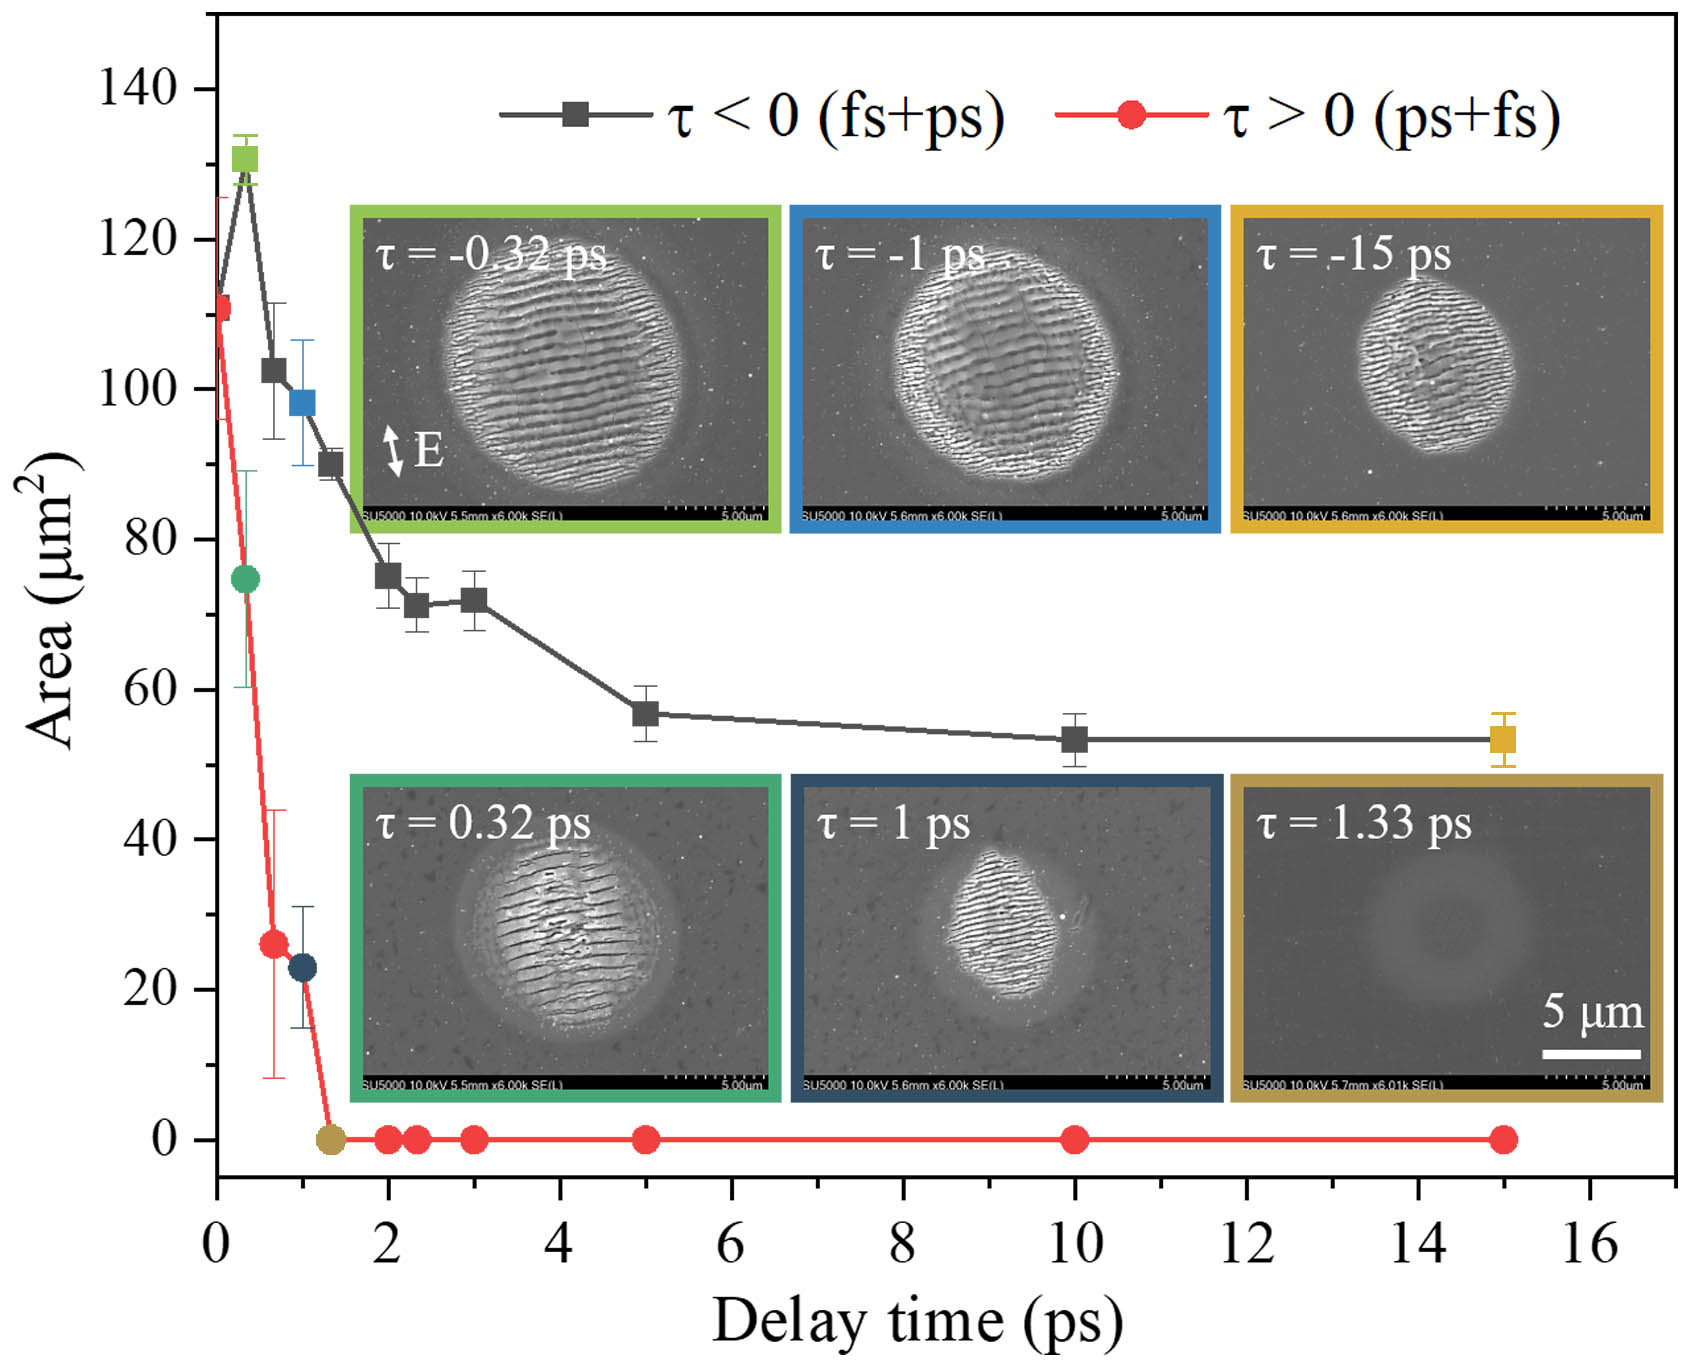
    Fig. 2. Induced ripple areas over the delay times. The markers in two curves correspond to different color blocks for the SEM insets.
    (a) Maximum electron density at different radial positions and delay times. (b) The electron density distributions corresponding to τ = ±1 ps, respectively. (c) The area center electron density over delay times. (d) Dependence of LSFL area on delay time. The insert shows an SEM picture of the LSFL covered area. The scale bar is 5 µm.
    Fig. 3. (a) Maximum electron density at different radial positions and delay times. (b) The electron density distributions corresponding to τ = ±1 ps, respectively. (c) The area center electron density over delay times. (d) Dependence of LSFL area on delay time. The insert shows an SEM picture of the LSFL covered area. The scale bar is 5 µm.
    Schematic diagram of electron excitation and energy absorption during irradiation of different FPDPSs. (a) The fs pulse arrives first. (b) The ps pulse arrives first.
    Fig. 4. Schematic diagram of electron excitation and energy absorption during irradiation of different FPDPSs. (a) The fs pulse arrives first. (b) The ps pulse arrives first.
    SymbolDescriptionValue
    n0Original material index2
    EgBand gap3.46 eV
    βMultiphoton absorption coefficient0.016cm3/GW2[23]
    ωLight frequency for 780 nmc/780 nm
    γAuger recombination coefficient0.96×1039cm6/s[24]
    τRElectron hole recombination time2.8 ns[25]
    cSpeed of light299,792,458 m/s
    ε0Permittivity of vacuum8.85×1012F/m[26]
    τeElectron collision time46 fs[27]
    meffEffective electron mass0.28m0[26]
    FIncident fluence0.45J/cm2
    ω0Spot radius5.5 µm
    τ1Parameters related to ps pulseτps/22ln2
    τ2Parameters related to fs pulseτfs/22ln2
    τfs, τpsPulse width120 fs, 2 ps
    rRadical position10 to10μm
    Table 1. Parameters for ZnO in Electron Density Rate Equation
    Weiyi Yin, Juan Song, Xiangyu Ren, Qian Yao, Xian Lin, Ye Dai. Nonlinear ionization control by temporally shaped fs+ps double-pulse sequence on ZnO[J]. Chinese Optics Letters, 2023, 21(2): 021602
    Download Citation