• Acta Physica Sinica
  • Vol. 69, Issue 16, 169601-1 (2020)
Kun-Lun Zhou1, Liu-Guan Ding1、2、3、*, Tian-Qi Qian1, Cong Zhu1, Zhi-Wei Wang1、4, and Li Feng3
Author Affiliations
  • 1Institute of Space Weather, Nanjing University of Information Science and Technology, Nanjing 210044, China
  • 2Binjiang College, Nanjing University of Information Science and Technology, Nanjing 210044, China
  • 3Key Laboratory of Dark Matter and Space Astronomy, Purple Mountain Observatory, Chinese Academy of Sciences, Nanjing 210008, China
  • 4China Polar Research Center, Shanghai 200000, China
  • show less
    DOI: 10.7498/aps.69.20200041 Cite this Article
    Kun-Lun Zhou, Liu-Guan Ding, Tian-Qi Qian, Cong Zhu, Zhi-Wei Wang, Li Feng. Statistical analysis of the relationship between type II radio enhancement and solar energetic particle event[J]. Acta Physica Sinica, 2020, 69(16): 169601-1 Copy Citation Text show less
    (a, c) Spectrum diagram of a type II radio burst with and without enhancement; (b, d) the height-time profile of CME1, CME2 and its shock.
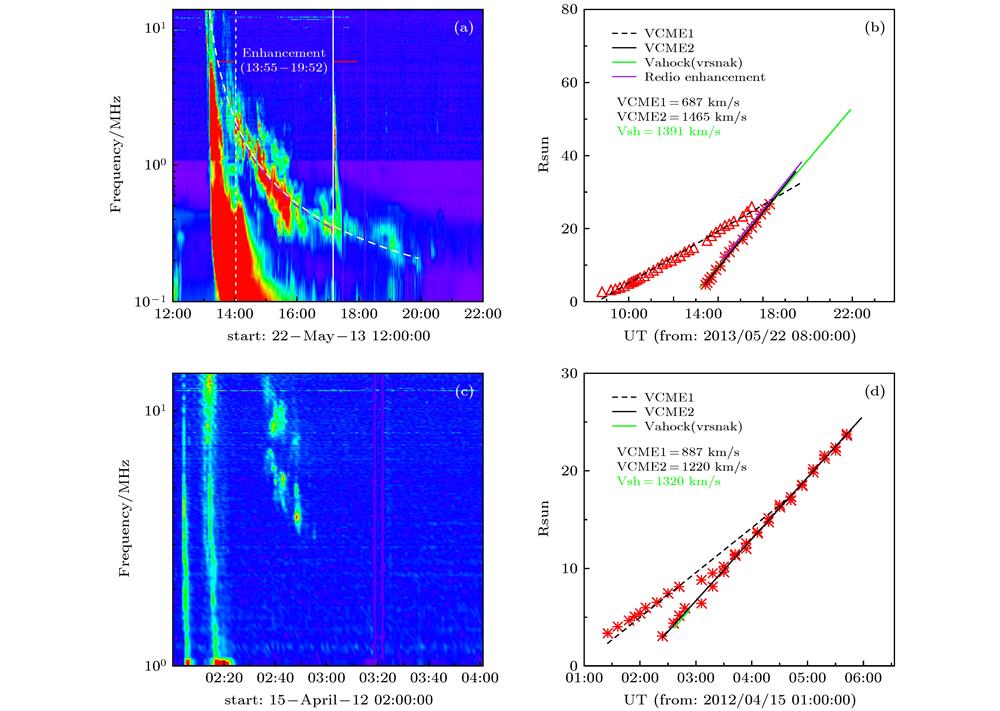
    Fig. 1. (a, c) Spectrum diagram of a type II radio burst with and without enhancement; (b, d) the height-time profile of CME1, CME2 and its shock.
    Histogram of CME velocity, mass, kinetic energy and flare class. Blue denotes radio enhancement events (Group I), and red denotes no enhancement events (Group II).
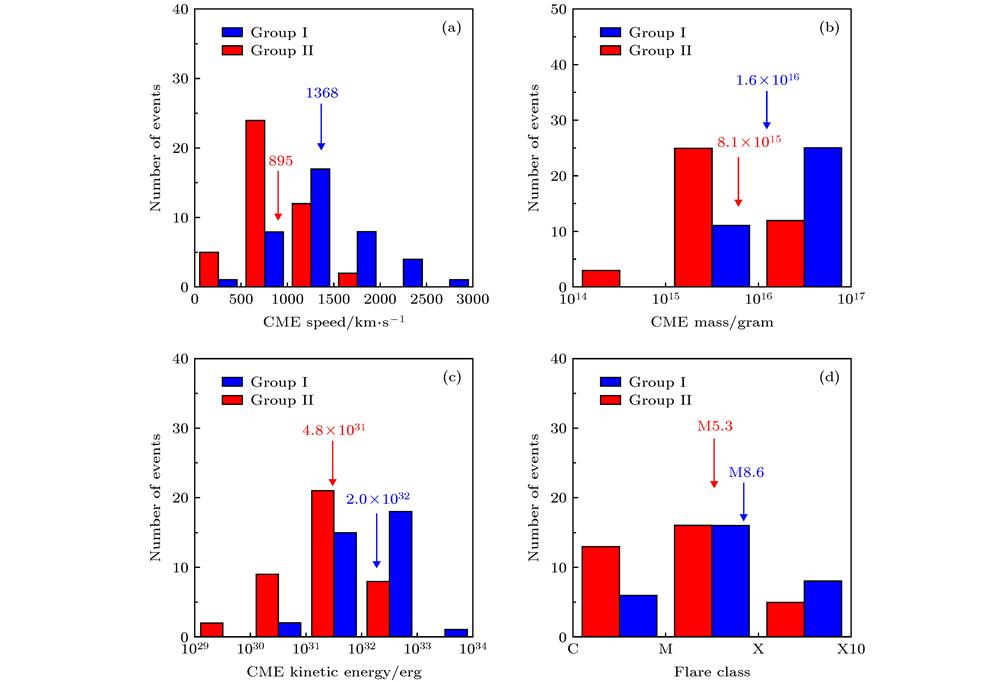
    Fig. 2. Histogram of CME velocity, mass, kinetic energy and flare class. Blue denotes radio enhancement events (Group I), and red denotes no enhancement events (Group II).
    Statistical histogram of SEP peak intensity.
    Fig. 3. Statistical histogram of SEP peak intensity.
    Histogram of CME velocity, mass, kinetic energy with SEP/No SEP, and blue denotes the events with SEP, and red denotes the events without SEP.
    Fig. 4. Histogram of CME velocity, mass, kinetic energy with SEP/No SEP, and blue denotes the events with SEP, and red denotes the events without SEP.
    Uses the starting moment of the SEP events as the reference point (0), histogram of the difference between type II radio burst start /stop time(T1/T2), radio enhancement start/stop(T3/T4), SEP stop time(T5) and the reference point respectively.
    Fig. 5. Uses the starting moment of the SEP events as the reference point (0), histogram of the difference between type II radio burst start /stop time(T1/T2), radio enhancement start/stop(T3/T4), SEP stop time(T5) and the reference point respectively.
    For radio enhancement events, (a, b) the bin-average distribution of the type IIs start/stop height in different speed intervals; (c, d) the histogram of the type IIs start/stop height.
    Fig. 6. For radio enhancement events, (a, b) the bin-average distribution of the type IIs start/stop height in different speed intervals; (c, d) the histogram of the type IIs start/stop height.
    For no radio enhancement events: (a, b) The bin-average distribution of the type IIs start/stop height in different speed intervals; (c, d) the histogram of the type IIs start/stop height.
    Fig. 7. For no radio enhancement events: (a, b) The bin-average distribution of the type IIs start/stop height in different speed intervals; (c, d) the histogram of the type IIs start/stop height.
    Histogram of N1, N2, N2-N1. N1 and N2 are the multiples of coronal density model used in the fitting of type II radio burst and its enhancement episode respectively.
    Fig. 8. Histogram of N1, N2, N2-N1. N1 and N2 are the multiples of coronal density model used in the fitting of type II radio burst and its enhancement episode respectively.
    Histogram of CME1 and CME2 with speed, angular width and overlap width.
    Fig. 9. Histogram of CME1 and CME2 with speed, angular width and overlap width.
    Kun-Lun Zhou, Liu-Guan Ding, Tian-Qi Qian, Cong Zhu, Zhi-Wei Wang, Li Feng. Statistical analysis of the relationship between type II radio enhancement and solar energetic particle event[J]. Acta Physica Sinica, 2020, 69(16): 169601-1
    Download Citation