• Photonics Research
  • Vol. 8, Issue 6, 875 (2020)
Ze Cai1, Xinbo Qi1, Deng Pan1, Shengyun Ji1, Jincheng Ni1, Zhaoxin Lao1, Chen Xin1, Jiawen Li1、2、*, Yanlei Hu1, Dong Wu1、3、*, and Jiaru Chu1
Author Affiliations
  • 1CAS Key Laboratory of Mechanical Behavior and Design of Materials, Department of Precision Machinery and Precision Instrumentation, University of Science and Technology of China, Hefei 230027, China
  • 2e-mail: jwl@ustc.edu.cn
  • 3e-mail: dongwu@ustc.edu.cn
  • show less
    DOI: 10.1364/PRJ.387495 Cite this Article Set citation alerts
    Ze Cai, Xinbo Qi, Deng Pan, Shengyun Ji, Jincheng Ni, Zhaoxin Lao, Chen Xin, Jiawen Li, Yanlei Hu, Dong Wu, Jiaru Chu. Dynamic Airy imaging through high-efficiency broadband phase microelements by femtosecond laser direct writing[J]. Photonics Research, 2020, 8(6): 875 Copy Citation Text show less
    Symmetric and asymmetric Airy beams and their dynamic imaging of a letter “T”. (a1) Cubic phase mask. (a2) Intensity distribution of the corresponding 2D Airy beam at the Fourier plane. (a3) Propagation dynamic of the Airy beam versus (sx,ξ). (b1) Symmetric cubic phase mask. (b2) The side-view profiles of the corresponding SAB. (b3) Intensity distribution of the SAB at the distances ξ/ξf=0,1,2,3 from the initial plane. (c1) Asymmetric cubic phase mask. (c2), (c3) The corresponding AAB (c2) during propagation and (c3) at the certain planes. (d) Schematic illustration of dynamic imaging of a letter “T” by the SAB at different distances. Insets: simulation. In the gray scale pattern, black corresponds to 0 and white to 2π radians. In the intensity scale, [0,1] for each pattern corresponds to [0, Imax].
    Fig. 1. Symmetric and asymmetric Airy beams and their dynamic imaging of a letter “T”. (a1) Cubic phase mask. (a2) Intensity distribution of the corresponding 2D Airy beam at the Fourier plane. (a3) Propagation dynamic of the Airy beam versus (sx,ξ). (b1) Symmetric cubic phase mask. (b2) The side-view profiles of the corresponding SAB. (b3) Intensity distribution of the SAB at the distances ξ/ξf=0,1,2,3 from the initial plane. (c1) Asymmetric cubic phase mask. (c2), (c3) The corresponding AAB (c2) during propagation and (c3) at the certain planes. (d) Schematic illustration of dynamic imaging of a letter “T” by the SAB at different distances. Insets: simulation. In the gray scale pattern, black corresponds to 0 and white to 2π radians. In the intensity scale, [0,1] for each pattern corresponds to [0, Imax].
    Femtosecond laser two-photon polymerization of symmetric and asymmetric cubic phase microplates. (a) Schematic illustration of the fabrication of SCPP and ACPP. (b) Image of the designed SCPP according to the phase mask by converting the phase to the corresponding height and discretization with a step of 100 nm. (c) SEM and AFM micrographs (half of the image) of the fabricated SCPP. (d) Height profiles of the desired, designed, and fabricated SCPP along the dashed lines in (b) and (c). (e), (f) Top-view SEM and three-dimensional AFM images of the fabricated ACPP.
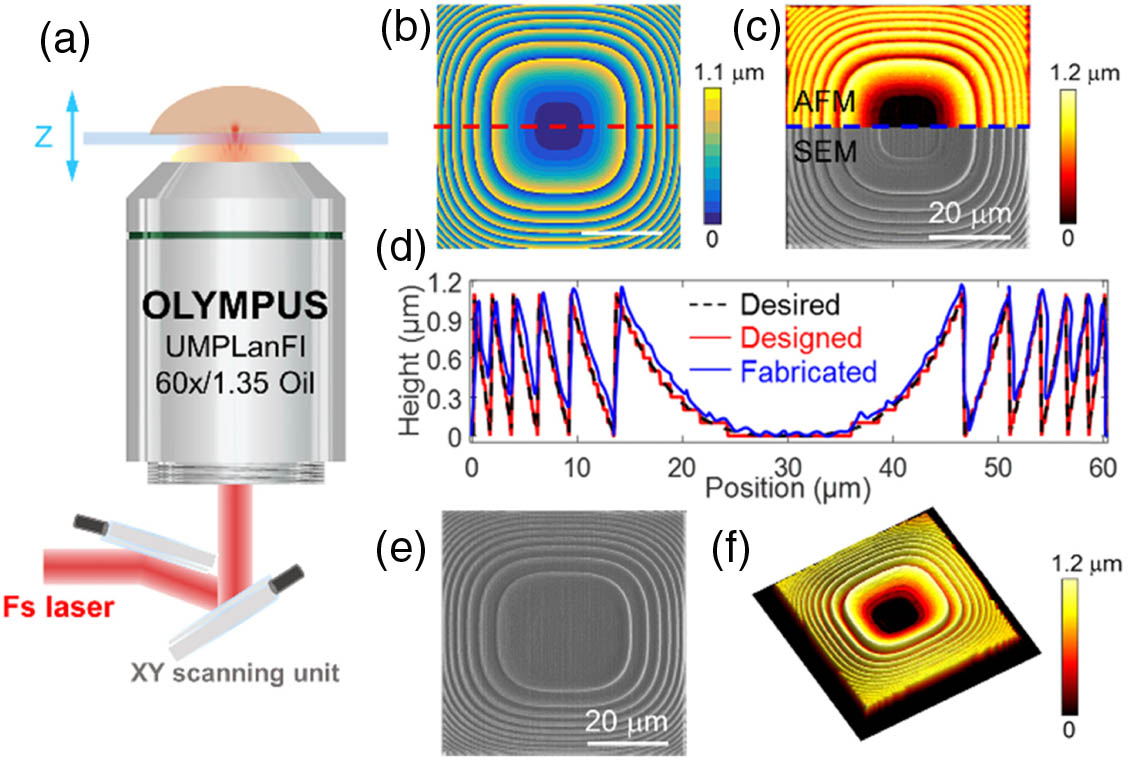
    Fig. 2. Femtosecond laser two-photon polymerization of symmetric and asymmetric cubic phase microplates. (a) Schematic illustration of the fabrication of SCPP and ACPP. (b) Image of the designed SCPP according to the phase mask by converting the phase to the corresponding height and discretization with a step of 100 nm. (c) SEM and AFM micrographs (half of the image) of the fabricated SCPP. (d) Height profiles of the desired, designed, and fabricated SCPP along the dashed lines in (b) and (c). (e), (f) Top-view SEM and three-dimensional AFM images of the fabricated ACPP.
    Generation of symmetric and asymmetric Airy beams. (a) Schematic of the experimental setup for generating and observing SAB and AAB. (b1)–(b2) Intensity distribution of the (b1) SAB and (b2) AAB generated by the fabricated phase plates at the propagation planes z=0,60,120, and 180 μm. (c) Transverse acceleration of the main lobes of the SAB and AAB as a function of beam propagation distance. (d) Lateral and vertical FWHMs of the main lobes of the SAB and AAB varying with propagation distance. Error bars in (c), (d) indicate standard deviation (s.d.). The ellipses with arrows indicate the corresponding coordinate axis according to the color.
    Fig. 3. Generation of symmetric and asymmetric Airy beams. (a) Schematic of the experimental setup for generating and observing SAB and AAB. (b1)–(b2) Intensity distribution of the (b1) SAB and (b2) AAB generated by the fabricated phase plates at the propagation planes z=0,60,120, and 180 μm. (c) Transverse acceleration of the main lobes of the SAB and AAB as a function of beam propagation distance. (d) Lateral and vertical FWHMs of the main lobes of the SAB and AAB varying with propagation distance. Error bars in (c), (d) indicate standard deviation (s.d.). The ellipses with arrows indicate the corresponding coordinate axis according to the color.
    Broadband generation of symmetric and asymmetric Airy beams. (a) Experimentally measured intensity profiles and optical efficiency of the generated SAB and AAB over a broadband illumination from 405 to 780 nm. All the intensity profiles are captured at z=180 μm. Error bars in efficiency represent s.d. (b) Distance between main lobes in lateral and vertical directions of the generated SAB (upper) and AAB (lower) as a function of beam propagation distance at 488, 532, and 633 nm. (c1) and (d1) Simulated (top row) and experimental (bottom row) results of the chromatic (c1) SAB and (d1) AAB at z=0,60,120,180 μm. (c2) Simulated (left) and experimental (right) results of the chromatic SAB in the x−z plane; (d2) experimental profiles of the chromatic AAB in the x−z plane (left) and in the y−z plane (right).
    Fig. 4. Broadband generation of symmetric and asymmetric Airy beams. (a) Experimentally measured intensity profiles and optical efficiency of the generated SAB and AAB over a broadband illumination from 405 to 780 nm. All the intensity profiles are captured at z=180  μm. Error bars in efficiency represent s.d. (b) Distance between main lobes in lateral and vertical directions of the generated SAB (upper) and AAB (lower) as a function of beam propagation distance at 488, 532, and 633 nm. (c1) and (d1) Simulated (top row) and experimental (bottom row) results of the chromatic (c1) SAB and (d1) AAB at z=0,60,120,180  μm. (c2) Simulated (left) and experimental (right) results of the chromatic SAB in the xz plane; (d2) experimental profiles of the chromatic AAB in the xz plane (left) and in the yz plane (right).
    Dynamic imaging by symmetric and asymmetric Airy beams. (a) Schematic illustration for the characterization of dynamic Airy imaging. (b1), (b2) Imaging results of letter “T” at different propagation planes via the (b1) SAB and (b2) AAB at 532 nm. Different imaging results are exhibited at different propagation planes by the SAB and AAB. (c1) A square shows various imaging results at different propagation planes via the SAB at 633 nm, the initial shape “square” (Chinese character “�?�”) at z=0, a Chinese character “田” at z=146 μm, and an ancient Chinese character “㗊” at z=177 μm. (c2) A circle shows various imaging results at different propagation planes via the AAB at 488 nm, a number “0” at z=0, a horizontal number “8” at z=67 μm, and a double-digit number “88” at z=122 μm. (d) Imaging results of the letter “T” at different propagation planes via the ACPP under white light illumination. Different information can be extracted at a certain propagation plane z=90 μm with different wavelength elements, a Chinese word “开” in the blue ingredient (488 nm), and a Greek symbol “π” in the red ingredient (633 nm).
    Fig. 5. Dynamic imaging by symmetric and asymmetric Airy beams. (a) Schematic illustration for the characterization of dynamic Airy imaging. (b1), (b2) Imaging results of letter “T” at different propagation planes via the (b1) SAB and (b2) AAB at 532 nm. Different imaging results are exhibited at different propagation planes by the SAB and AAB. (c1) A square shows various imaging results at different propagation planes via the SAB at 633 nm, the initial shape “square” (Chinese character “�?�”) at z=0, a Chinese character “田” at z=146  μm, and an ancient Chinese character “㗊” at z=177  μm. (c2) A circle shows various imaging results at different propagation planes via the AAB at 488 nm, a number “0” at z=0, a horizontal number “8” at z=67  μm, and a double-digit number “88” at z=122  μm. (d) Imaging results of the letter “T” at different propagation planes via the ACPP under white light illumination. Different information can be extracted at a certain propagation plane z=90  μm with different wavelength elements, a Chinese word “开” in the blue ingredient (488 nm), and a Greek symbol “π” in the red ingredient (633 nm).
    Flexibility and robustness of the symmetric cubic phase during mechanical stretch. (a) The length and width of the SCPP on a PDMS substrate almost remain unchanged during the stretch coefficient in the x direction varying from 0% to 85%, and the optical efficiency maintains stable as well. Error bars on Dx,Dy, and efficiency indicate s.d. (b) The optical efficiency of the SCPP on a PDMS substrate has a good consistency during 100 cyclic stretch with a stretch coefficient of 50%. Error bars represent s.d. (c1)–(c3) Images of the SCPP on a PDMS substrate, the generated intensity profiles, and the imaging results (c1) before, (c2) during, and (c3) after stretch. The SCPP can keep its structure and optical properties unchanged. (d) Higher stretch coefficient (>90%) makes the structure break along the vein. After releasing the stretch, the cracked parts can joint together perfectly. The SEM micrograph shows the tiny crack at the joint. Because of the nice restoration, the corresponding intensity profiles and imaging results are not influenced.
    Fig. 6. Flexibility and robustness of the symmetric cubic phase during mechanical stretch. (a) The length and width of the SCPP on a PDMS substrate almost remain unchanged during the stretch coefficient in the x direction varying from 0% to 85%, and the optical efficiency maintains stable as well. Error bars on Dx,Dy, and efficiency indicate s.d. (b) The optical efficiency of the SCPP on a PDMS substrate has a good consistency during 100 cyclic stretch with a stretch coefficient of 50%. Error bars represent s.d. (c1)–(c3) Images of the SCPP on a PDMS substrate, the generated intensity profiles, and the imaging results (c1) before, (c2) during, and (c3) after stretch. The SCPP can keep its structure and optical properties unchanged. (d) Higher stretch coefficient (>90%) makes the structure break along the vein. After releasing the stretch, the cracked parts can joint together perfectly. The SEM micrograph shows the tiny crack at the joint. Because of the nice restoration, the corresponding intensity profiles and imaging results are not influenced.
    Ze Cai, Xinbo Qi, Deng Pan, Shengyun Ji, Jincheng Ni, Zhaoxin Lao, Chen Xin, Jiawen Li, Yanlei Hu, Dong Wu, Jiaru Chu. Dynamic Airy imaging through high-efficiency broadband phase microelements by femtosecond laser direct writing[J]. Photonics Research, 2020, 8(6): 875
    Download Citation