Abstract
This Letter presents a new type of optical fiber probe used to detect temperature, whose structure is very simple. The optical fiber probe is filled with cholesteric liquid crystals (CLCs) whose reflected light varies with temperature. The experimental results show that the proposed sensor can achieve a temperature sensitivity of 5.64 nm/°C in the temperature range of 18–40°C. The sensor has the advantages of simple structure, low cost, and easy mass manufacture. Its size is very tiny (the tapered structure, 125 μm in maximum diameter and <300 μm in length) and it is easy to integrate and measure. Meantime, the tapered structure of the probe is also ideal for measuring small samples such as cells and microfluidic channels, which will be a promising candidate for monitoring temperature fluctuations in small spaces.Temperature is a very important physical parameter to be monitored and accurately controlled in many fields, such as industrial production, aviation safety, and clinical medicine[1–3]. Compared with traditional temperature sensors, optical fiber temperature sensors have attracted intense research interests due to advantages of small size, remote monitoring capability, high sensitivity, and anti-electromagnetic interference[4,5]. Until now, many kinds of optical fiber temperature sensors have been manufactured by combining various optical technologies, such as multimode interference and optical coupling technology. In addition to sensing technology, the sensing performance can be further improved by filling temperature-sensitive materials. Many temperature-sensitive materials, such as polymers and metal oxides, can be integrated on the surface or in internal space of the optical fiber structure, which have been reported[6–8]. In the current market, commercial fiber sensors are mostly fiber Bragg gratings (FBGs), which have good repeatability and stable sensing characteristics[9]. By ultraviolet (UV) irradiation or nanoetching technology, FBGs can be prepared to meet the working requirements of different temperature ranges[10]. However, the commercial prospects of FBG temperature sensors are limited because they have difficulty in reaching high sensitivity or precision[11].
In recent years, many scholars have become interested in liquid crystals (LCs) because of their good sensing capabilities[12–14]. The LC has special functional groups in its molecular structure. The functional groups will form chemical bonds in different directions according to the external environment, thus changing the structure of the LC. Therefore, LCs can be used to detect chemical reagents, gas, and temperature, which is of great significance in sensors[15–19]. In addition, as a means of detecting temperature, LCs have the advantages of fast response, reversibility, and high selectivity, which is important. In 2018, Zhang et al. made a polymer cross-linked coating based on the cholesteric LCs (CLCs) reflective band[20]. The coating can be coated on glass to produce different colors at different temperatures by cross-linking different areas, which can roughly detect temperature changes. But, the coating can only be applied to the surface of the glass, making it impossible to measure the temperature of tiny objects or some extreme environments.
CLCs are interesting optical materials, whose reflected light will change depending on the change of temperature. CLCs contain many layers of molecules whose direction of each layer is the same, while the arrangement direction of two adjacent layers of molecules is slightly rotated. When the molecular arrangement rotates 360° and returns to the original direction, the distance between the two layers where the molecular arrangement is exactly the same is called the pitch () of the CLC. The layers of CLCs are stacked into a spiral structure, which acts as a Bragg reflector with a reflection wavelength that depends on the . The selected reflection wavelength () is expressed as , where is the average refractive index. As can be seen from the equation, the change of the of CLCs will change the reflected light wavelength of the CLCs. The of the CLCs is affected by the molecular structure of the CLCs, so we can control the by changing the molecular structure of the CLCs. The molecular structure can be altered by external influences (such as temperature, electricity, and chemical material) and can be shown by a variation of the reflected wavelength. Therefore, the reflected light wavelength of CLCs can be exploited to detect the change of external temperature according to the extent of the change in the [21–23].
Sign up for Chinese Optics Letters TOC. Get the latest issue of Chinese Optics Letters delivered right to you!Sign up now
Until now, different kinds of optical fiber temperature sensors based on multi-wavelength interference have been manufactured, which mostly are Mach–Zehnder and Fabry–Perot interferometers. For the former, due to their high cost and technical requirements, they are difficult to realize mass manufacture[24]. For the latter, their probes are readily available through chemical etching or film forming techniques[25]. However, due to the uncontrollability of the manufacturing process, its repeatability is very low, and its structural parameters are difficult to control accurately[26]. In our group’s previous experiments, we introduced LCs into the Fabry–Perot cavity to produce a highly sensitive reflective fiber temperature sensor, which detected the change of the external temperature through the Vernier effect of the periodic envelope[27]. Compared with the ordinary Fabry–Perot interferometer, the structure of the sensor is relatively simplified, and the sensitivity is up to 19 nm/°C. However, in order to achieve high sensitivity, the sensor needs to have a gold plated film on the reflective end surface to achieve better sensing effects. Moreover, due to the formation of the structure of the Fabry–Perot cavity, the sensor structure is still relatively complex.
In this Letter, we propose and investigate a highly sensitive temperature sensor based on a special optical fiber probe. The optical fiber probe is infilled with CLCs whose Bragg structure reflects incident light. We can detect changes in temperature by changes in the wavelength of reflected light. Experimental verification shows that the sensor has high temperature sensitivity; a sensitivity of higher than 5 nm/°C has been experimentally demonstrated in the temperature range of 18–40°C. This temperature sensor will be a promising candidate for monitoring temperature fluctuations in small spaces due to its simple structure and very tiny scale (cells, microfluidic channel, etc.).
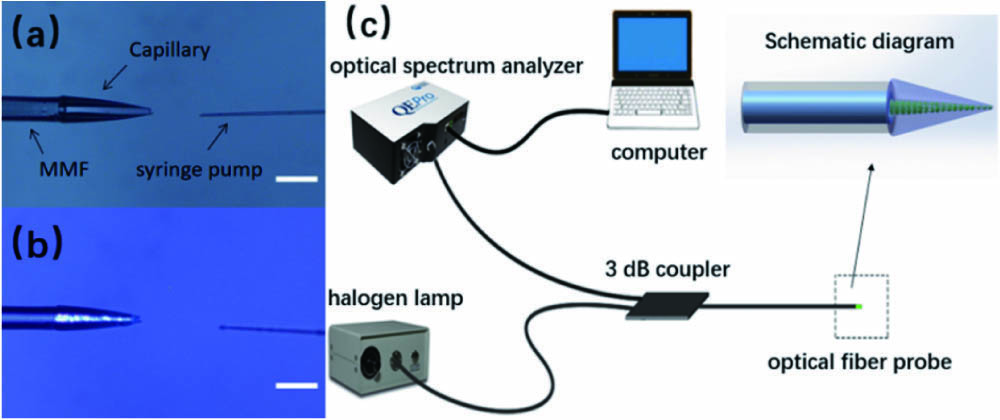
The initial structure of the miniature optical fiber probe without LCs used in this experiment is shown in Fig. 1(a). The left part is the structure of the optical fiber probe. To fabricate the optical fiber probe, a multimode fiber (MMF, 62.5 μm core diameter and 125 μm cladding diameter) and a hollow capillary (030150, 30 μm inner diameter and 125 μm outer diameter after removing coating) were first cleaved using an optical fiber cleaver (CT-30, Fujikura Ltd., Japan) to ensure the quality of the end face. Under the same light source intensity, the MMF can transmit more light than the single mode fiber, and the spectrometer can receive a higher intensity reflection spectrum. The well-cleaved MMF was then spliced with the hollow capillary by using a standard fusion optical fiber splicer (FSM-60s, Fujikura Ltd., Japan). In the next step, the tapered optic fiber probe is fabricated by stretching the optic fiber while it is being heated in a standard fusion optical fiber splicer. The discharge time is 10 ms, with a discharge intensity of three units. The finished fiber probe was then placed in HF to corrode for 40 min to remove the coating layer and reduce the volume. The resulting fiber optic probe structure is shown in Fig. 1(a). As can be seen from the figure, the length of the liquid crystal is about 250 μm. The bottom diameter of the tapered structure filled with liquid crystals is 30 μm and the diameter of the taper tip is less than 20 μm.

Figure 1.(a) Structure of the optical fiber sensing probe with 250 μm tapered length under the microscope. (b) Optical fiber sensing probe in the polarization state. (c) Experimental setup diagram and optical fiber probe schematic diagram in this experiment. The scale bar is 100 μm.
The other part is a syringe pump, which consists of a common syringe and a tapered capillary tube whose diameter is less than 10 μm. The tapered capillary tube was prepared using the flame heated taper-drawing technique. In this experiment, the syringe pump is used to inject the LC into the microcavity of the optical fiber probe. When the LC fills the entire structure, we dip a small amount of UV glue to encapsulate the probe and irradiate with a UV lamp for one minute. The LC in this experiment is a mixed LC, which consists of 20.5 wt% of cholesteryl chloride, 59.5 wt% of cholesterol oleyl carbonate, and 20 wt% of cholesteryl chloroformate. The mixed LC is a natural CLC and has a very high stability. The three kinds of LC materials are acquired from Aladdin, America.
Figure 1(b) presents a photograph of a sensor probe with 250 μm tapered length, which is captured by polarized microscopy. As can be seen from the figure, the LC is evenly distributed in the probe without bubbles. In the polarization state, the LC displays bright light. During this experiment, in general, the length of the tapered structure is less than 300 μm. So far, the sensor probe has been made, and the size of the whole sensor probe is about , which is very tiny and convenient for integration and application.
The configuration of the experimental system is shown in Fig. 1(c). A halogen lamp (Guangzhou Jingyi Photoelectric, China) is connected to one of the input ports of a 3 dB coupler. The output port of the coupler is connected to the optical fiber probe, which is located in an incubator chamber. The reflected light from the optical fiber probe is transmitted by an MMF and measured by an optical spectrum analyzer (QE PRO-ABS, Ocean Optics) with a resolution of 0.02 nm. A temperature probe (50-II, Fluke Co., Ltd., U. S.) is placed to the side of the optical fiber probe in the chamber to calibrate and test the temperature of the optical fiber probe.
For CLCs, also mentioned above, the CLCs can selectively reflect light when the wavelength , where is the average refractive index, , and is the helical pitch. is the concentration of the chiral dopant, and is the helical twisting power. For LCs, decreases as the temperature increases, and increases as the temperature increases, so will become smaller, but the change is very slow[28,29]. Meantime, it has been reported that the of some CLCs has increased in a certain temperature range[30], and the LC we used in the experiment is one of them. Therefore, in theory, it is clear that the wavelength of reflected light increases as the temperature increases. In general, under the influence of and , the change in with temperature is non-linear, but it can be seen as linear over a specific temperature range.
In the experiment, the temperature optical fiber probe with LCs was placed in a small incubator chamber. The temperature of the fiber probe is changed by changing the temperature of the incubator. The temperature was increased from 18°C to 38°C with steps of 2°C. The reflection spectra of the optical fiber probe were recorded by a spectrometer. Figure 2 shows the reflected spectra received by the spectrometer at different temperatures. As we can see from the picture, with the increasing of temperature, the whole wavelength moves to the right, which corresponds to the red shift. At the same time, the intensity of the reflected light gradually decreases. When the temperature was raised to 40°C, the rate of change increased sharply, and the reflection peak of CLCs disappeared gradually, as shown in the illustration. This is due to the CLCs in this experiment reaching isotropy at the phase transition temperature of approximately 40°C, and their periodic helical structure did not exist anymore.
Figure 2.Reflection spectra of the fiber probe at different temperatures. The inset shows the expanded spectrum at 36℃, 38℃, and 40℃.
The part of increasing temperature in Fig. 3 shows the relationship between the wavelength shift of the reflected spectrum and the temperature. In the heating process, the linear equation of was obtained, and the linear correlation coefficient achieved 0.993. These results indicated that the reflectance spectra of CLCs exhibit a good linear relationship with temperature. To verify the repeatability of the temperature sensor, the drift of the reflected light wavelength was recorded during cooling in the same temperature range (18°C to 38°C, steps of 2°C). A week later, the probe’s temperature character was measured again, and the shifts in the wavelength of the reflected light were recorded. As shown in Fig. 3, by linear fitting of the experimental data points, the curve sensitivity during the cooling process was as high as 5.49 nm/°C with a linearity of 0.992. The curve sensitivity of the repeated curve was as high as 5.45 nm/°C with a linearity of 0.991. The temperature curve shows that the sensor has stable performance and good repeatability. Small temperature differences may be due to uneven temperature distribution in the incubator chamber. Thus, it can be seen that for the temperature probes, the relationship between the wavelength of reflected light and temperature is relatively stable.
Figure 3.Reflection spectra during the temperature increasing process and the cooling process, and the reflection spectrum measured repeatedly one week later.
Next, the factors influencing the sensor made in this experiment are discussed. As can be seen from above, the structure of the sensor is very simple. As we all known, the pitch of the cholesteric liquid crystal can be changed by the electric fields. The electric fields also have a tiny effect on the experimental results. Generally speaking, the electric field strength of 1.6 V/μm causes the wavelength shift of Bragg reflection as small as 3–5 nm[19]. In other words, we need to add hundreds of voltage to our structure to have a significant impact on the results. Our sensors are mainly designed and applied in the field of cells and microfluidic channels; these fields will not have a large electric field to disturb the temperature. Therefore, the effect of the electric field can be ignored in this paper. There are only three factors that affect the sensor efficiency, namely, the length of the filled LCs, clearing points of CLCs, and the type of LCs.
Firstly, the effect of the length of LC’s filling on the sensor is discussed. For CLCs, the is only about 300 nm, which is far less than the length of the filled LCs. Therefore, in the optical fiber probe, the LCs can always form a complete , which reflects constant specific wavelength information in the case of the certain external temperatures. So, for the optical fiber sensor probe made in this experiment, the length of LCs filled in the probe has no influence on its sensing characteristics.
Secondly, the effect of the clearing point of CLCs on the sensor is discussed. For LC temperature sensing, the clearing point of LCs is a big influencing factor, which directly affects the maximum temperature of LC sensing. As the temperature increases to the clearing point, gets smaller and smaller and eventually becomes zero. The LC becomes isotropic and loses its sensing function. As the temperature decreases, the LC regains its anisotropy. As shown in Fig. 4(a), when the LC recovered to anisotropy, it was still capable of temperature sensing. Within 30 s, the LC’s pitch returned to its normal position. In about 5 min, the intensity of the reflected light returns to a higher level, which is very low compared to the initial strength. In general, the CLCs that had reached the clearing point did not return to their original light intensity. For the temperature sensor, what we care about is the temperature sensing characteristics in the wavelength range of reflected light, so the fluctuation of light intensity does not affect the temperature sensitivity. However, the decrease of the peak intensity would lead to higher signal-to-noise ratio and wider full width at half-maximum (FWHM), and thus a lower temperature resolution. In fact, the measurement of light intensity is likely to be used as a temperature parameter for other applications. The sensor temperature characteristics of the probe after restoring anisotropy, and the results are shown in the Fig. 4(b). As can be seen from the figure, the optical fiber probe sensing characteristics do not change much, which is important for the sensor.
Figure 4.(a) Recovery characteristics of the probe. (b) Comparison of temperature sensing characteristics before reaching the clearing point and after restoring anisotropy.
The last is the discussion of the types of LCs in the study of sensing characteristics. The LCs previously used in this experiment were natural CLCs with stable properties. In the next experiment, the experiment was carried out using a synthetic chiral CLC. Various CLC materials are prepared by doping chiral dopants with different concentrations into two nematic LCs (NLCs). TEB30A, which has a medium refractive index (, ), shows a phase transition from an anisotropy phase to an isotropic phase at 61°C. Chiral dopants R811 with concentrations of 30 wt%, 25 wt%, and 20 wt% are mixed with TEB30A to produce three groups of CLCs. Next, the types of LCs were changed. The NLC E7, which has a higher refractive index (, ), shows a phase transition from an anisotropy phase to an isotropic phase at 59°C. The other NLC BYLC5214-000, which has a lower refractive index (, ), shows a phase transition from an anisotropy phase to an isotropic phase at 92°C. Chiral dopants R811 with concentrations of 25 wt% are mixed with TEB30A, E7, and BYLC5214-000 to produce an additional three groups of CLCs. The LCs materials used in this part were obtained from Shijiazhuang Chengzhi Yonghua Display Materials Co., Ltd.
The sensor characteristics are shown in Fig. 5. As can be seen from the figure, for the same LCs, the higher the concentration of chiral dopants, the higher the sensitivity of temperature sensing, while the narrower the corresponding measurement range. It can be seen from the figure that for different LCs doped with the same chiral agent, all of their peak wavelengths will blue shift as the temperature increases, which is contrary to the previous CLCs. This is because the of most chiral CLCs decreases with increasing temperature. By comparing the sensitivity of three LCs to temperature, we speculate that the sensitivity increases as the refractive index of the LC used increases. Regrettably, as the sensitivity increases, the measurement range also decreases accordingly. We can choose the type of LCs and concentrations of chiral dopants according to the needs of the problem in practical applications.
Figure 5.Temperature sensing characteristics of chiral dopants with different concentrations and different kinds of LCs.
In summary, a temperature sensor based on a CLC infilling capillary tube is proposed and investigated, which requires no complicated chemistry or expensive equipment in this Letter. After infilling CLCs in the probe, it can form a helical structure, which can vary with temperature and reflect the incident light, which can be used to reflect temperature changes. Thus, the temperature change causes a shift in the reflected spectrum (red shift or blue shift). The experimental result exhibits that for the sensor infilling natural CLCs in the experiment, the temperature measurement ranges from 18°C to 38°C with a sensitivity of 5.64 nm/°C. In addition, sensitivity can also be improved by changing the type of LCs. In conclusion, the designed optical fiber sensors filled with LCs show simple structure, excellent temperature measuring sensitivity, and very tiny volume, which will be a promising candidate for monitoring temperature fluctuations.
References
[1] M. Fajkus, J. Nedoma, R. Martinek, V. Vasinek, H. Nazeran, P. Siska. Sensors, 17, 111(2017).
[2] R. Fan, Z. Mu, J. Li. J. Phys. Chem. Solids, 129, 307(2019).
[3] V. R. Mamidi, S. Kamineni, L. N. S. P. Ravinuthala, V. Thumu, V. R. Pachava. Fiber Integr. Opt., 33, 325(2014).
[4] A. Ghazanfari, W. Li, M. C. Leu, Y Zhuang, J. Huang. Mater. Design, 112, 197(2016).
[5] H. E. Joe, H. Yun, S. H. Jo, M. B. Jun, B. K. Min. Int. J. Precis. Eng. Mannuf.-Green Technol., 5, 173(2018).
[6] I. Hernández-Romano, M. Cruz-Garcia, C. Moreno-Hernández, D. Monzón-Hernández, E. O. López-Figueroa, O. E. Paredes-Gallardo, M. Torres-Cisneros, J. Villatoro. Opt. Express, 24, 5654(2016).
[7] H. Sun, H. Luo, X. Wu, L. Liang, Y. Wang, X. Ma, J. Zhang, M. Hu, X. Qiao. Sens. Actuators B Chem., 245, 423(2017).
[8] M. Ramakrishnan, G. Rajan, Y. Semenova, G Farrell. Sensors, 16, 99(2016).
[9] C. Y. Hong, Y. F. Zhang, M. X. Zhang, L. M. G. Leung, L. Q. Liu. Sens. Actuators A: Phys., 244, 184(2016).
[10] D. P. Zhang, J. Wang, Y. J. Wang, X. Dai. Meas. Sci. Technol., 25, 075105(2014).
[11] M. A. Gonzalez-Reyna, E. Alvarado-Mendez, J. M. Estudillo-Ayala, E. Vargas-Rodriguez, M. E. Sosa-Morales, J. M. Sierra-Hernandez, D. Jauregui-Vazquez, R. Rojas-Laguna. IEEE Photon. Technol. Lett, 27, 1141(2015).
[12] S. J. Woltman, G. D. Jay, G. P. Crawford. Nat. Mater., 6, 929(2007).
[13] A. Hussain, A. S. Pina, A. C. A. Roque. Biosens. Bioelectron., 25, 1(2009).
[14] I. H. Lin, D. S. Miller, P. J. Bertics, C. J. Murphy, J. J. de Pablo, N. L. Abbott. Science, 332, 1297(2011).
[15] J. L. Adgate, A. Bartekova, P. C. Raynor, J. G. Griggs, A. D. Ryan, B. R. Acharya, C. J. Volkmann, D. D. Most, S. Lai, M. D. Bonds. J. Environ. Monit., 11, 49(2009).
[16] H. Xu, X. Bi, X. Ngo, K. L. Yang. Analyst, 134, 911(2009).
[17] Y. Wang, Q. Huang, W. J. Zhu, M. H. Yang. IEEE Photon. Technol. Lett, 30, 833(2018).
[18] C. Zhang, D. Y. Fu, C. L. Xia, L. S. Yao, C. L. Lu, W. N. Sun, Y. J. Liu. Chin. Opt. Lett., 18, 011402(2020).
[19] J. Y. Hu, C. L. Xia, D. Y. Fu, C. Zhang, L. S. Yao, C. L. Lu, W. M. Sun, Y. J. Liu. Appl. Phys. Express, 12, 102017(2019).
[20] P. Zhang, A. J. J. Kragt, A. P. H. J. Schenning, L. T. de Haan, G. F. Zhou. J. Mater. Chem. C, 6, 7184(2018).
[21] Y. Han, K. Pacheco, C.W. M. Bastiaansen, D. J. Broer, R. P. Sijbesma. J. Am. Chem. Soc., 132, 2961(2010).
[22] C. K. Chang, S. W. Chiu, H. L. Kuo, K. T. Tang. Appl. Phys. Lett., 100, 043501(2012).
[23] A. Mujahid, H. Stathopulos, P. A. Lieberzeit, F. L. Dickert. Sensors, 10, 4887(2010).
[24] Y. M. Raji, H. S. Lin, S. A. Ibrahim, M. R. Mokhtar, Z. Yusoff. Opt. Laser Technol., 86, 8(2016).
[25] R. H. Wang, X. G. Qiao. IEEE Photon. Technol. Lett., 26, 1430(2014).
[26] G. L. Zhang, M. H. Yang, M. Wang. Opt. Fiber Technol., 19, 618(2013).
[27] F. R. Wang, Y. J. Liu, Y. L. Lu, L. L. Zhang, J. Ma, L. Wang, W. M. Sun. Opt. Lett., 43, 5355(2018).
[28] Y. L. Lu, Y. Yang, Y. Wang, L. Wang, J. Ma, L. L. Zhang, W. M. Sun, Y. J. Liu. Opt. Express, 26, 3277(2018).
[29] J. Li, S. Gauzia, S. T. Wu. Opt. Express, 12, 2002(2004).
[30] Y.-J. Liu, P.-C. Wu, W. Lee. Mol. Cryst. Liq. Cryst., 596, 37(2014).