
Yarui WU, Honglei LIU, Chunhui LOU. Spatial-temporal characteristics of air quality in Xi'an during the COVID-19 pandemic[J]. Journal of Atmospheric and Environmental Optics, 2024, 19(1): 47
- Journal of Atmospheric and Environmental Optics
- Vol. 19, Issue 1, 47 (2024)
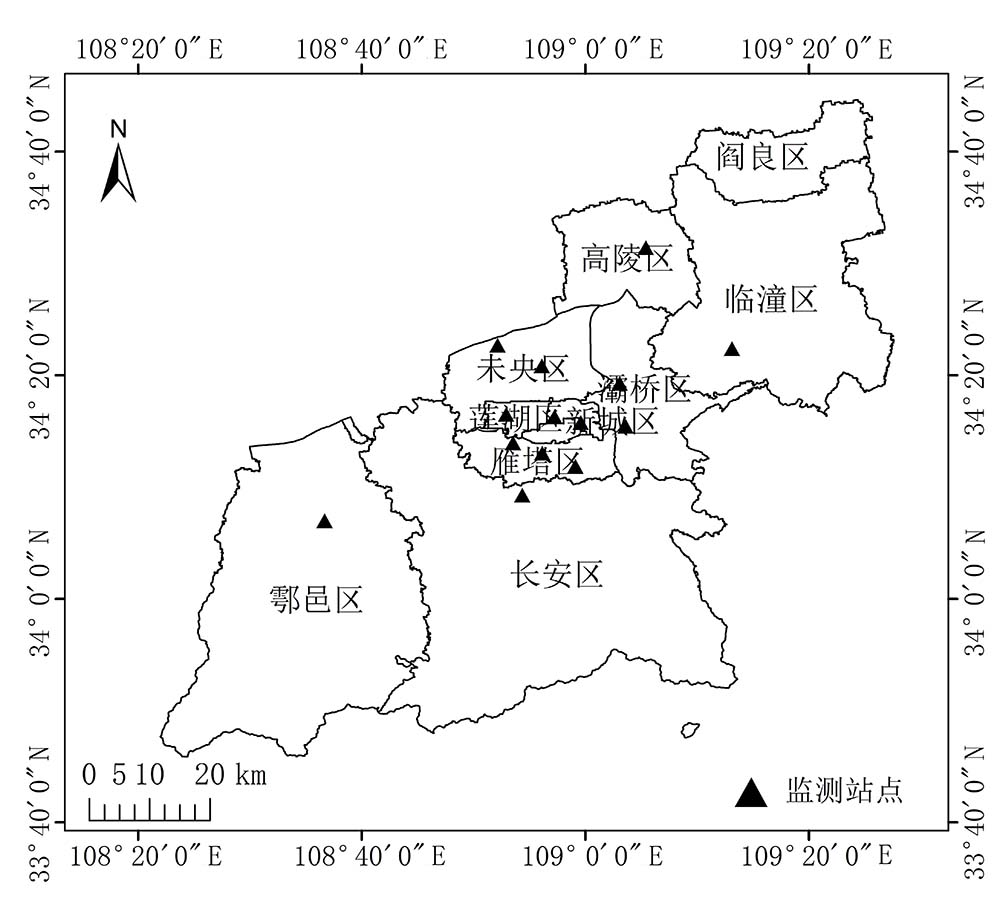
Fig. 1. Location of the study area and distribution of the stations in Xi'an
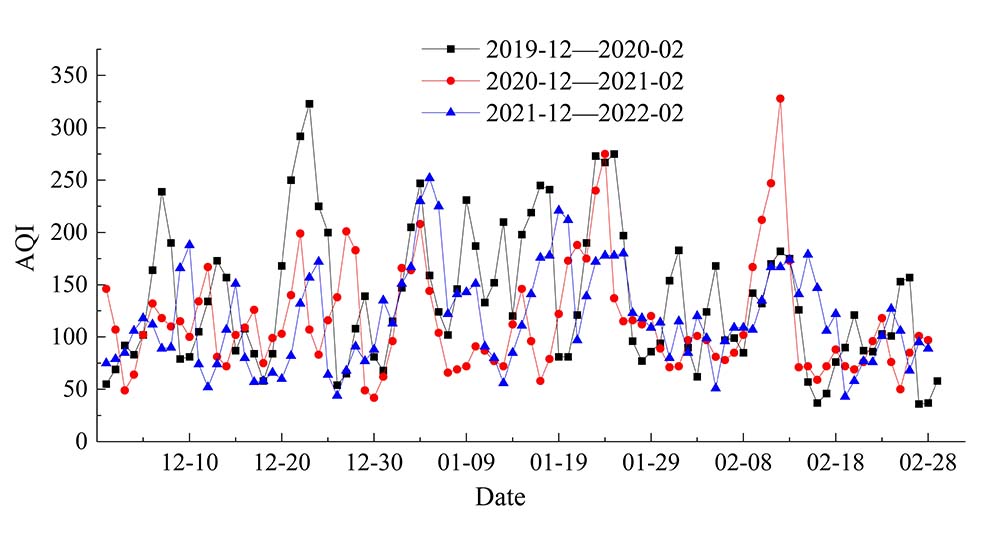
Fig. 2. Comparison of AQI averages in Xi'an during the corresponding study periods in different years
Fig. 3. Comparison of AQI averages for the two outbreak control periods in 2020 (a) and 2022 (b) compared to the same time period in other years
Fig. 4. Comparison of the number of days with different air quality level in Xi'an during the strict pandemic control period of 2020 and 2022
Fig. 5. Comparison of pollutant concentration distribution in Xi'an at different stages from 2019 to 2022
Fig. 6. Comparison of main pollutant concentrations in Xi'an during different pandemic prevention stages from 2019 to 2022
Fig. 7. Radar plot of pollutant characteristics during strict epidemic control period in Xi'an in 2020 (a) and 2022 (b)
Fig. 8. Comparison of diurnal variations of AQI, precipitation and average temperature (a) with wind speed and relative humidity (b) during the study period
Fig. 9. Rose chart of wind direction during the study period during the research period in Xi'an
Fig. 10. Cluster analysis of backward trajectory at 500 m height during strict epidemic control period in Xi'an in February 2020 (a) and January 2022 (b)
Fig. 11. Topographic map of Xi'an City
Fig. 12. Comparison of inner city travel intensity during Spring Festival in Xi'an during the study period
| |||||||||||||||||||||||||||||||||||||||||||||||||||||||||||||||||||||||
Table 1. Comparison of air quality in different periods of Xi'an
|
Table 2. Air quality in eastern cities of the Fenhe and Weihe plains in January 2022
|
Table 3. Number of cluster tracks and corresponding PM2.5 concentration


Set citation alerts for the article
Please enter your email address

© Copyright 2018-2021 | Chinese Laser Press. All Rights Reserved 沪ICP备15018463号-20