• Chinese Optics Letters
  • Vol. 17, Issue 11, 112201 (2019)
Ling Xiong, Erhui Qi, Xiao Luo*, Feng Zhang, Donglin Xue, and Xuejun Zhang
Author Affiliations
  • Key Laboratory of Optical System Advanced Manufacturing Technology, Changchun Institute of Optics, Fine Mechanics and Physics, Chinese Academy of Sciences, Changchun 130033, China
  • show less
    DOI: 10.3788/COL201917.112201 Cite this Article Set citation alerts
    Ling Xiong, Erhui Qi, Xiao Luo, Feng Zhang, Donglin Xue, Xuejun Zhang. Stitching swing arm profilometer test for large aperture aspherics[J]. Chinese Optics Letters, 2019, 17(11): 112201 Copy Citation Text show less

    Abstract

    We implemented a stitching swing arm profilometer (SSAP) test for the inner and outer regions of a large aspheric surface with a short arm. The SSAP was more capable of improving sampling density of surface and was less sensitive to system error, like vibration noise and air-table noise. Firstly, a calculation model was built to evaluate the sampling density of the SSAP test. Then, sensitivity to system noise was tested when different lengths of arm were used. At the end, an experiment on a 3 m diameter aspheric mirror was implemented, where test efficiency was promoted, and high sampling density was achieved.

    Fabrication for a large optical surface is difficult because of the complicated tooling needed for all stages of manufacturing and measuring. It is especially difficult for fabricating a silicon carbon (SiC) surface, because this kind of material is so hard to remove. The general fabricating process for a large SiC optical surface includes milling, grinding, and polishing. For SiC mirrors, the material removal rate of polishing is much lower than that of grinding. To achieve a high efficiency for overall fabrication, it is a good way to remove as much residual error of the surface shape as possible during the grinding process. Generally, during the abrasive ground state, low-order Zernike aberration terms are a major part to be processed, while mid-order Zernike aberration terms are left to be fine ground before the polishing state. In this case, the test ability for mid-order Zernike aberration terms is so important for profile measurement that guides the fabricating process from the grinding state into the polishing state.

    For testing large aperture optics, a swing arm profilometer (SAP) has shown its powerful performance for testing either ground or polished, concave or convex, spherical or aspherical surfaces[16]. As a profilometer test, the SAP test ability for map details depends on sampling density. For testing a 1500 mm diameter asphere, giving consideration to sampling density and time consumption, 72 scan arcs were experimented to be applicative[7]. For larger aperture optics, it will cost more time to keep the same sampling density, and the length of the swing arm would be longer to fit the aperture, where air bearing errors and system vibration will be amplified[8].

    In this Letter, we discussed a dual-region stitching mode for SAP with a short arm to test the large aspheric surfaces. On the one hand, in dual-region stitching mode, the sampling density was increased with the same time elapsed. On the other hand, SAP system errors were reduced with a shorter arm. Firstly, based on the principle of the SAP test, an evaluation method of SAP sampling density was discussed, and an evaluation model was built. Then, a test mode was programmed to improve the sampling density; meanwhile, system sensitivity to noise was tested with a long arm and a short arm separately. Finally, a stitching SAP (SSAP) test experiment was conducted on a 3 m aspheric mirror, which verified the test ability for mid-order Zernike aberration terms with high accuracy and efficiency.

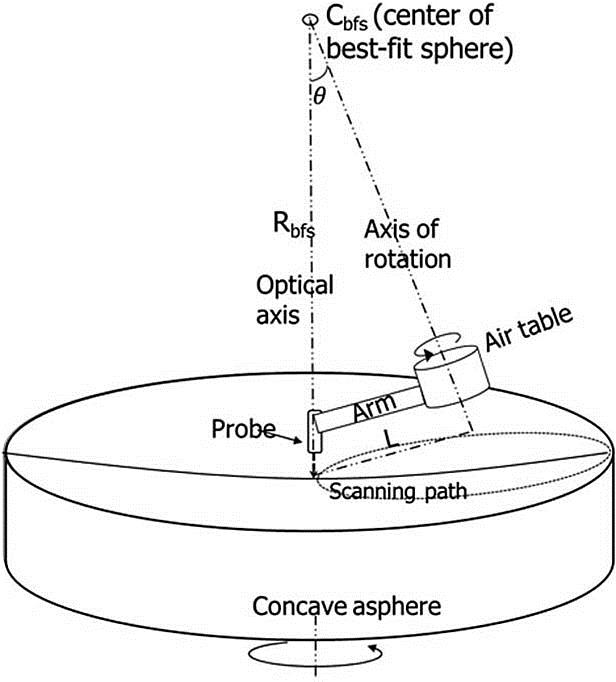
    The basic geometry of the SAP is shown in Fig. 1, where a probe is mounted at the end of an arm that is fixed on a high accuracy air-table, whose rotation axis is tilted and goes through the center of the best fit sphere (BFS). By rotating the mirror, a two-dimensional profile can be obtained with multiple scans. The tilt-angle θ of the air-table is given by θ=arcsin1(L/Rbfs), where L is the distance between the probe tip and rotation axis of the air-table, and Rbfs is the radius of curvature of the BFS.

    Principle of the SAP test.

    Figure 1.Principle of the SAP test.

    For a traditional SAP test, work from the University of Arizona was reported on testing a 1.4 m aspheric surface. During a test, the off-axis parabolic surface was scanned in 64 equally spaced arcs, as the profiling pattern shown in Fig. 2. The test accuracy and ability were limited, while the size of fragmentary details on the surface is smaller than the sampling interval.

    Profiling pattern of 64 scan arcs used for measuring the 1.4 m convex asphere; coordinate units are mm (Ref. [1], Fig. 3).

    Figure 2.Profiling pattern of 64 scan arcs used for measuring the 1.4 m convex asphere; coordinate units are mm (Ref. [1], Fig. 3).

    We designed a hung SAP with a short arm to test aspheric surfaces[8]. In the pattern shown in Fig. 3, the arm scanned a whole circle over the surface. The sampling density was increased, especially on the edge of the surface map. Moreover, test accuracy was improved with the short arm. According to this pattern, sampling distribution of an SAP test was determined by a given diameter D of the mirror, length L of the arm, position Xt of the center of the rotation, and number N of scan arcs.

    Profile pattern of 72 scan circles.

    Figure 3.Profile pattern of 72 scan circles.

    In coordination with the whole trajectory shown in Fig. 3, the center of the first arc was located at the +X axis; the next arc was the one that contra rotated around original point O by αinterp, where αinterp=2π/N and so on for other arcs.

    Coordination Xp1 of the outermost intersection of two arcs at the +X axis was Xp1=2·L·cos(αinterp).

    Coordination of other intersections at the +X axis can be expressed as Xpi=2·L·cos(i·αinterp).

    According to circular symmetry, at line OQ, which was away from the X axis shown in Fig. 4, the outermost point Q1 was intersected by the first and the second arcs. The distance rq1 from Q1 to original point O was rq1=2·L·cos(αinterp2).

    Geometrical diagram of Q intersections.

    Figure 4.Geometrical diagram of Q intersections.

    The position of other intersections at line OQ can be expressed as rqi=2·L·cos[(2i1)·αinterp/2].

    So far, given the number of the scan arcs, the radial positions of P, Q intersections were demonstrated.

    For the SAP test for the 1.4 m mirror, as reported in Ref. [1], the length of the arm was about 1250 mm. The maximal area of corresponding grids formed by the intersections was 7000mm2; if the length of the arm was 350 mm, the maximal area of the corresponding grids would shrink to 1100mm2, as shown in Fig. 5.

    Area distribution of corresponding gridding of the intersections.

    Figure 5.Area distribution of corresponding gridding of the intersections.

    The scale of mid-order Zernike aberration terms is related to the whole size of the surface map. To evaluate the sampling density generally, the scan pattern was discussed with the radial position normalized by 2L, and the area of the sampling grids was divided by whole area of the surface map, whose radius equals 2L. The normalized sampling area density distribution of different scan arcs from 48 arcs to 144 arcs was shown in Fig. 6.

    Normalized sampling area density distribution of different scan arcs used.

    Figure 6.Normalized sampling area density distribution of different scan arcs used.

    Due to the character of the SAP test, the sampling density was not uniformly distributed in scope of the whole aperture. For L:D=1:4, the angle range of each arc is 360 deg. The sampling density in the middle radial region was sparser than in the center and outer regions of map. To improve sampling density in those regions, one way is to increase the number of scan arcs, but that means the testing time would be increased, while the density of high density part would also be increased, which is needless. As shown in Fig. 6, the ratio of the sampling area density was improved to 0.015% with 144 scan arcs. For a constant scan speed, like 100 mm/s, for testing 3 m diameter optics, each arc was scanned four times, which would cost about 7.6 h.

    Aiming to improve test efficiency, we discussed an SSAP test mode, with less scan arcs in the inner region and more scan arcs in the outer region.

    For the outer region test shown in Fig. 7, radial coordinations of corresponding intersections were rpi=(Xl+L)·cos(i·αinterp)+L2(Xl+L)2·sin(i·αinterp),rqi=(Xl+L)·cos[(i12)αinterp]+L2(Xl+L)2·sin[(i1/2)αinterp],where Xl is the radius of the blank inner circle region. Knowing the distribution of the intersections, it is easy to calculate area of the gridding formed.

    (a) Profile pattern and (b) geometrical diagram of Q intersections for the outer region of the SSAP test.

    Figure 7.(a) Profile pattern and (b) geometrical diagram of Q intersections for the outer region of the SSAP test.

    According to Fig. 6, the sampling density reached the lowest at 0.60.8 times of the radius. To keep the sampling density, the overlapped region was designed at 0.8 times of the radius of inner region. For testing the 3 m diameter mirror, a short arm was set to be about 460 mm; then, the radial width of the overlap region was 340 mm. There were 64 scan arcs in the inner region, and 144 scan arcs in the outer region. As the scan pattern shown in Fig. 8(a), it cost 6.7 h for a whole surface test. The ratio of sampling area density was within about 0.02%, as shown in Fig. 8(b). Compared with SAP, the SSAP promoted test efficiency.

    (a) Stitching profile pattern for 3 m diameter mirror. (b) Ratio of sampling area density.

    Figure 8.(a) Stitching profile pattern for 3 m diameter mirror. (b) Ratio of sampling area density.

    The displacement sensor used was a spectral confocal sensor from Micro-Epsilon Corporation. Its type was IFS2401-3 in the measuring range of 3 mm. Calibration for the sensor was implemented on a single point diamond turning (SPDT) machine shown in Fig. 9(a)[9]. The noise level of the SPDT machine was below 10 nm, and the measuring distance was the working distance of the sensor probe at about 16 mm. Sensor stability with a sampling frequency of 40 Hz is shown in Fig. 9(b). Noise from the sensor was σp=0.052μm.

    (a) Calibration of sensor on SPDT and (b) noise from the sensor.

    Figure 9.(a) Calibration of sensor on SPDT and (b) noise from the sensor.

    In the initial SAP test system for abrasive grinding, scan radius L was 758 mm. As shown in Fig. 10, the SAP system noise for testing a single position was σS1=0.142μm.

    Noise of the SAP system with arm length of 758 mm.

    Figure 10.Noise of the SAP system with arm length of 758 mm.

    Noise related to the length of the arm was σl1=σs12σp2=0.132μm.

    In the SSAP test system, scan radius L was reduced to 467 mm. As shown in Fig. 11, the SSAP system noise at a single position was σs2=0.090μm.

    Noise of the SSAP system with arm length of 467 mm.

    Figure 11.Noise of the SSAP system with arm length of 467 mm.

    So, the noise related to the length of the short arm was σl2=σs22σp2=0.073μm.

    From the result above, the SSAP system with a short arm displayed better ability on noise suppression.

    A 3 m concave off-axis aspheric mirror with 1600 μm aspheric departure was fabricated with the SAP test system as main method of metrology. During a test in the initial fabricating period, the surface was scanned in 72 equally spaced arcs. When the surface residue converged within 20 μm in peak valley (PV), considering the test for mid-order Zernike aberration terms, the mirror was scanned in 144 equally spaced arcs. In our lab, the SAP was rigidly mounted to an axis of the Gantry numerical control machine tool (GNCMT) to allow in situ measurement, where the air-table can be tilted and moved to a specified location for test. The arm could be adjusted or switched with different types of lengths. The mirror was set on the turntable shown in Fig. 12, where the radius of the scan arcs was 758 mm.

    SAP in situ measuring a 3 m concave aspheric mirror with swing radius of 758 mm.

    Figure 12.SAP in situ measuring a 3 m concave aspheric mirror with swing radius of 758 mm.

    The SAP test results of 72 arcs and 144 arcs were compared to show the test ability of the SAP with different sampling densities. The test results of 72 arcs are shown in Figs. 13(a) and 13(b), where the test repeatability with the first 37 low-order Zernike aberration terms removed was 1.644 μm in PV and 0.136 μm in root mean square (RMS), as shown in Fig. 13(c).

    (a), (b) Comparison of SAP test data in 72 scan arcs. (c) Difference with first 37 low-order Zernike aberration terms removed.

    Figure 13.(a), (b) Comparison of SAP test data in 72 scan arcs. (c) Difference with first 37 low-order Zernike aberration terms removed.

    Test results of 144 arcs are shown in Figs. 14(a) and 14(b), where the test repeatability was promoted to 1.307 μm PV and 0.094 μm RMS, as shown in Fig. 14(c). Compared with 72 arcs, the mode of 144 arcs exhibited better performance in measuring mid-order Zernike aberration terms.

    (a), (b) Comparison of SAP test data in 144 scan arcs. (c) Difference with 37 low-order Zernike aberration terms removed.

    Figure 14.(a), (b) Comparison of SAP test data in 144 scan arcs. (c) Difference with 37 low-order Zernike aberration terms removed.

    Finally, we implemented the SSAP test on a 3 m mirror, as shown in Fig. 15. For testing the inner region, the SAP was placed as exhibited in Fig. 15(a), where the probe scanned across the center of the mirror, and there were 64 scan arcs. For testing the outer region, the SAP was placed as exhibited in Fig. 15(b), where the probe scanned across the edge of the mirror, and there were 144 scan arcs. The result of the SSAP test is shown in Fig. 16. The test repeatability was 0.940 μm in PV and 0.099 μm in RMS. The PV terms were better than that of the SAP test, and the RMS was in the same level as the SAP test with 144 scans. There was some stitching error left in the SSAP test, needing to be improved in further work.

    (a), (b) SSAP test results for 3 m mirror. (c) Test repeatability with 37 low-order Zernike aberration terms removed.

    Figure 16.(a), (b) SSAP test results for 3 m mirror. (c) Test repeatability with 37 low-order Zernike aberration terms removed.

    SAP in situ measuring with small swing radius of 460 mm. (a) Scan test for inner region. (b) Scan test for outer region.

    Figure 15.SAP in situ measuring with small swing radius of 460 mm. (a) Scan test for inner region. (b) Scan test for outer region.

    The SAP test has played an important role in testing large aspheric optics. This Letter discussed a stitching way of the SAP test with a short arm to achieve high quality and efficient test for large or extremely large optics in the future. The experiment on a 3 m aspheric mirror verified the feasibility of the SSAP test. Moreover, it demonstrated an improved performance of test repeatability of 0.940 μm PV, rivaling the SAP with a long arm, whose test repeatability was 1.307 μm in PV.

    It is easy to know that the performance of the SSAP would be better when testing axis-symmetric aspheric surfaces, because with the SSAP test mode, the measuring range of the displacement sensor will be reduced in the inner and outer regions. It means a probe with a higher accuracy can be used, and higher precision measurement would be achieved.

    So, the work in this Letter exhibited a potential mode for the SAP test to achieve measurement of larger optics in the future. Further study will focus on improving the accuracy of the stitching algorithm.

    References

    [1] P. Su, C. Oh, R. E. Parks, J. H. Burge. Proc. SPIE, 7426, 74260J(2009).

    [2] J. H. Burge, S. Benjamin, D. Caywood, C. Noble, M. Novak, C. Oh, R. Parks, B. Smith, P. Su, M. Valente, C. Zhao. Proc. SPIE, 7426, 74260L(2009).

    [3] Y. Wang, P. Su, R. E. Parks, C. Oh, J. H. Burge. Opt. Eng., 51, 073606(2012).

    [4] A. Lewis, S. Oldfield, M. Callender, A. Efstathiou, A. Gee, C. King, D. Walker. Proceedings of Simposio de Metrología, 101(2006).

    [5] H. Jing, Z. Lin, L. Ma, S. Wu, F. Wu. J. Eur. Opt. Soc.-Rap. Publ., 6, 11052(2011).

    [6] L. Xiong, X. Luo, Z. Liu, L. Zheng, F. Zhang, X. Zhang. Acta Opt. Sin., 35, 1212002(2015).

    [7] L. Xiong, X. Luo, E. Qi, F. Zhang, D. Xue, X. Zhang. Infrared Laser Eng., 47, 217003(2018).

    [8] X. Luo. Chin. Opt. Lett., 12, S22202(2014).

    [9] L. Xiong, X. Luo, H. Hu, Z. Zhang, F. Zhang, L. Zheng, X. Zhang. Opt. Eng., 56, 084101(2017).

    Ling Xiong, Erhui Qi, Xiao Luo, Feng Zhang, Donglin Xue, Xuejun Zhang. Stitching swing arm profilometer test for large aperture aspherics[J]. Chinese Optics Letters, 2019, 17(11): 112201
    Download Citation